When I delete a lot of indices in kibana,about 20 Indies.And I got a lot stats api timeout error.
And,I never use the api[Cluster Stats,Nodes Stats,Index Stats].But I have enabled stack monitoring in kibana.
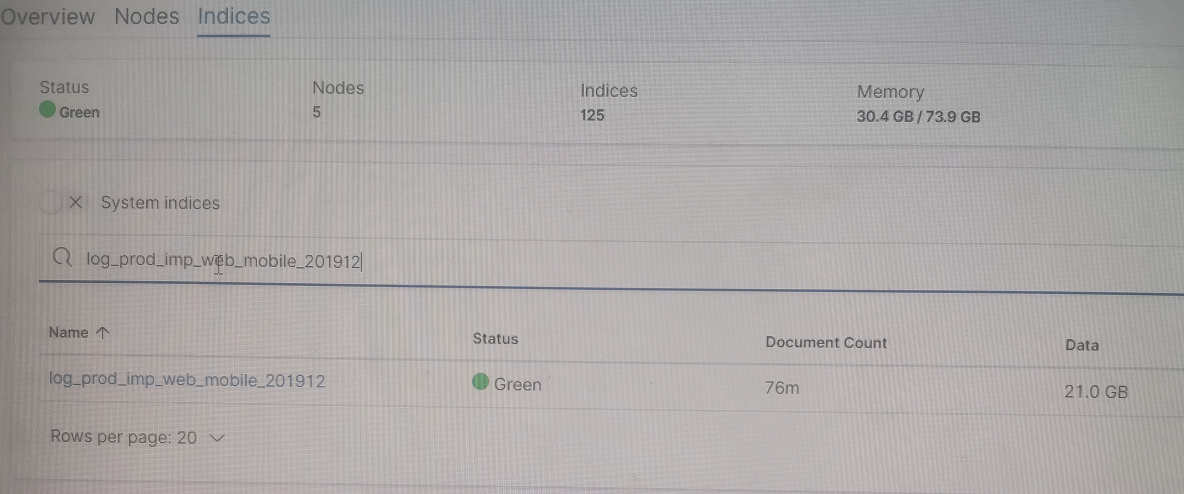
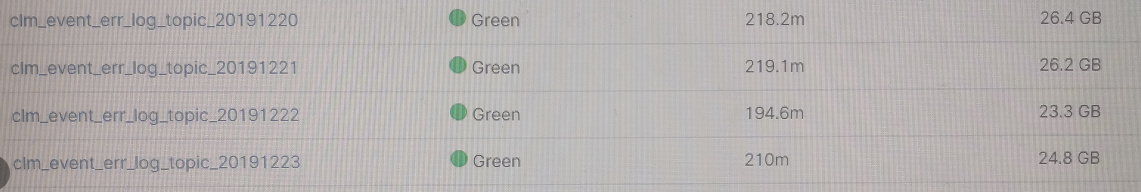
I create index by day.My Es Cluster have five nodes,Three mater,four data node.About 1TB data.And about 200 indices.And I use NAS disk.
Sometimes I will delete some indices.And then I will do a log delete commond in Dev-Tools.Every Indies just have about ten documents.It is a lot small indices。
After I do some Delete commond.The Elasticsearch will have a lot timeout error.And then ES cluster will become slowly in search in sometimes.I just worried about it.
I never use the api[Cluster Stats,Nodes Stats,Index Stats] in my coding.Does it coused by stack monitoring ,who can help me?
Delete commond,Such as.
(1)DELETE log_api_projects_20191110,log_api_projects_260191111,log_api_projects_20191112,log_api_projects_20191113,log_api_projects_20191114,log_api_projects_20191115,log_api_projects_2019116,log_api_projects_20191117
(2)DELETE log_api_projects_20191100,log_api_projects_260191011,log_api_projects_20191012,log_api_projects_20191013,log_api_projects_20191014,log_api_projects_20191015,log_api_projects_2019016,log_api_projects_20191017
(3)....