Hello, I am currently using Kibana to analayze our revenues using stacked bars each months per year. There is a minor issue that I would like to fix but had a hard time how to do.
For example, the values start from March, 2018 instead of January. So January and February bars have values of 2019 and 2020 only, and March bar has all 2018, 2019, and 2020 infos.
Even though 2018 is before 2019 and 2020, it is ended up locating next to 2020. I would like to put them in an order if possible so that the colors of each year become gradient.
I used x-axis as timestamp_month in ascending order and date histogram with yearly minimum interval.
Or is there any example that I can set missing value of sum into 0 by using JSON input?
Do you have a field including the full timestamp including year? That's probably the easiest approach. If year and month and separate, we can look into creating a scripted field to concatenate those two and use that as our x-axis aggregation.
Thank you for your reply first. Currently, I do have the full timestamp including year and I also created another fields that can be filtered by month or year.The bar is required to show each month's revenue with all past years so that they can compare revenue per month of each year.
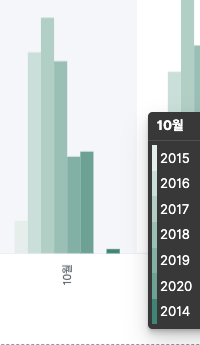
Please see the picture I attached for the reference if I was not clear what I asked. As you see, years are becoming out of an order because 2014 does not exist from January to September and it had a revenue starting from October.
I put
{
    "missing": "0"
}
for y-axis JSON input which is sum of revenue field so that it can show 0 if there is none from January to September and the years can be in an order, but I don't think it is quite working well...
For your first suggestion, I am not sure whether it can be drawn as I wanted. And for the second suggestion, would you possible to provide example of how to create a scripted field to concatenate in x-axis?
Or is it possible to apply JSON input in Kibana lens?
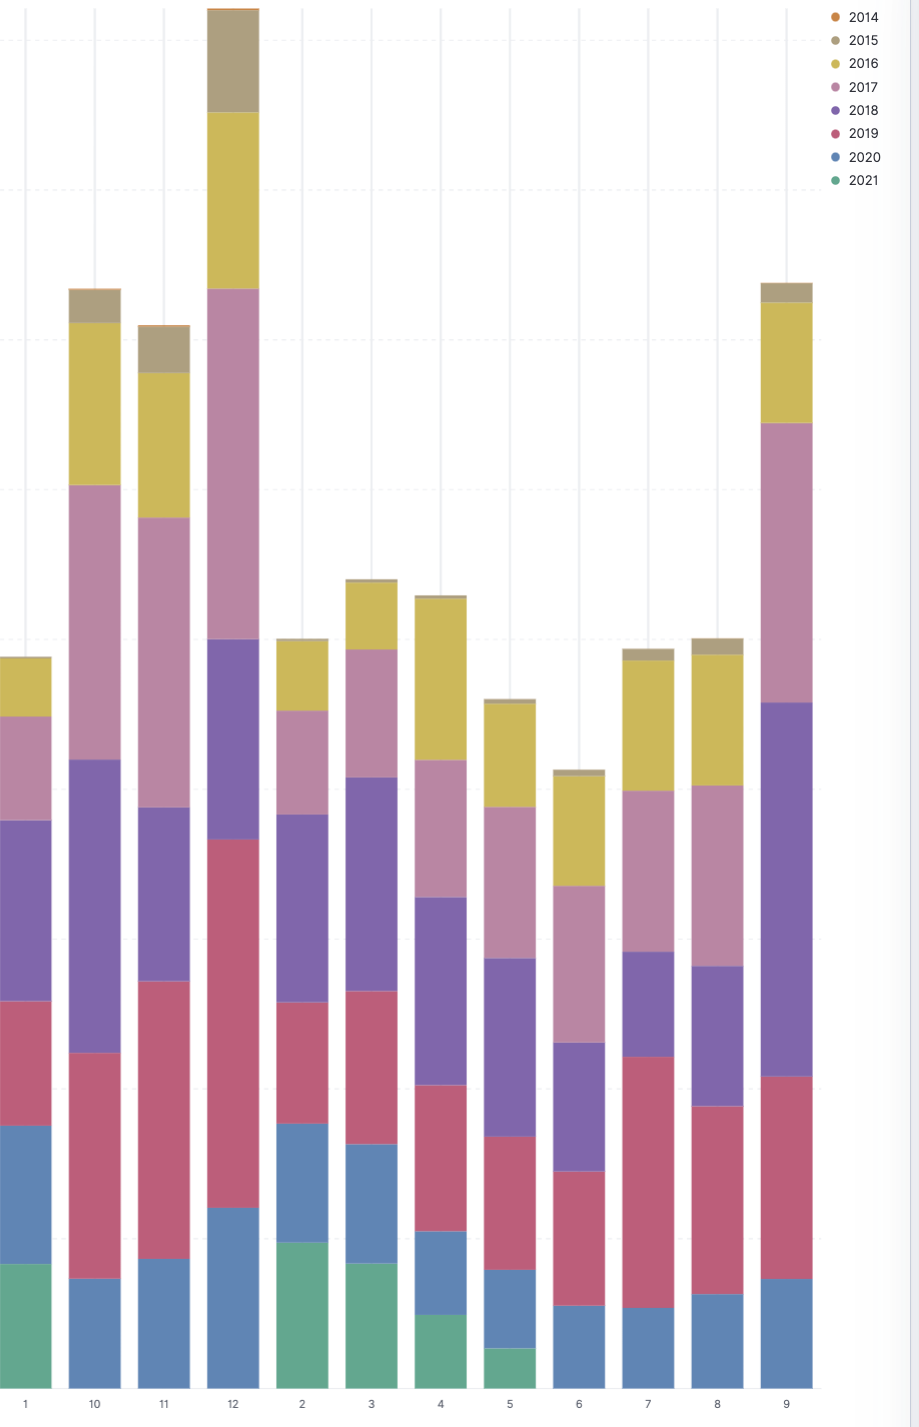
As you see the picture below, making an order by year will work by using stacked bar through lens, but now I am facing x-axis part. I used timestamp_month, which is a string so it ended up not in an order as I preferred. I used JSON input before by adding 0 in front of months from January to September so that x-axis will be in an order. Is it possible to do JSON input for lens?
If I put descending order for the year, it works but it looks little weird since the current year comes first, not at the end. Please let me know if there is any other way to modify this...
Apache, Apache Lucene, Apache Hadoop, Hadoop, HDFS and the yellow elephant
logo are trademarks of the
Apache Software Foundation
in the United States and/or other countries.