I am having 3 nodes ElasticSearch cluster on AWS.
Facts:
- ElasticSearch 6.2.2 deployed using docker.
- 3x identical c5.large instances (2x vCPU, 3.6 GB RAM)
- All are identical master + data nodes and use same docker image and settings.
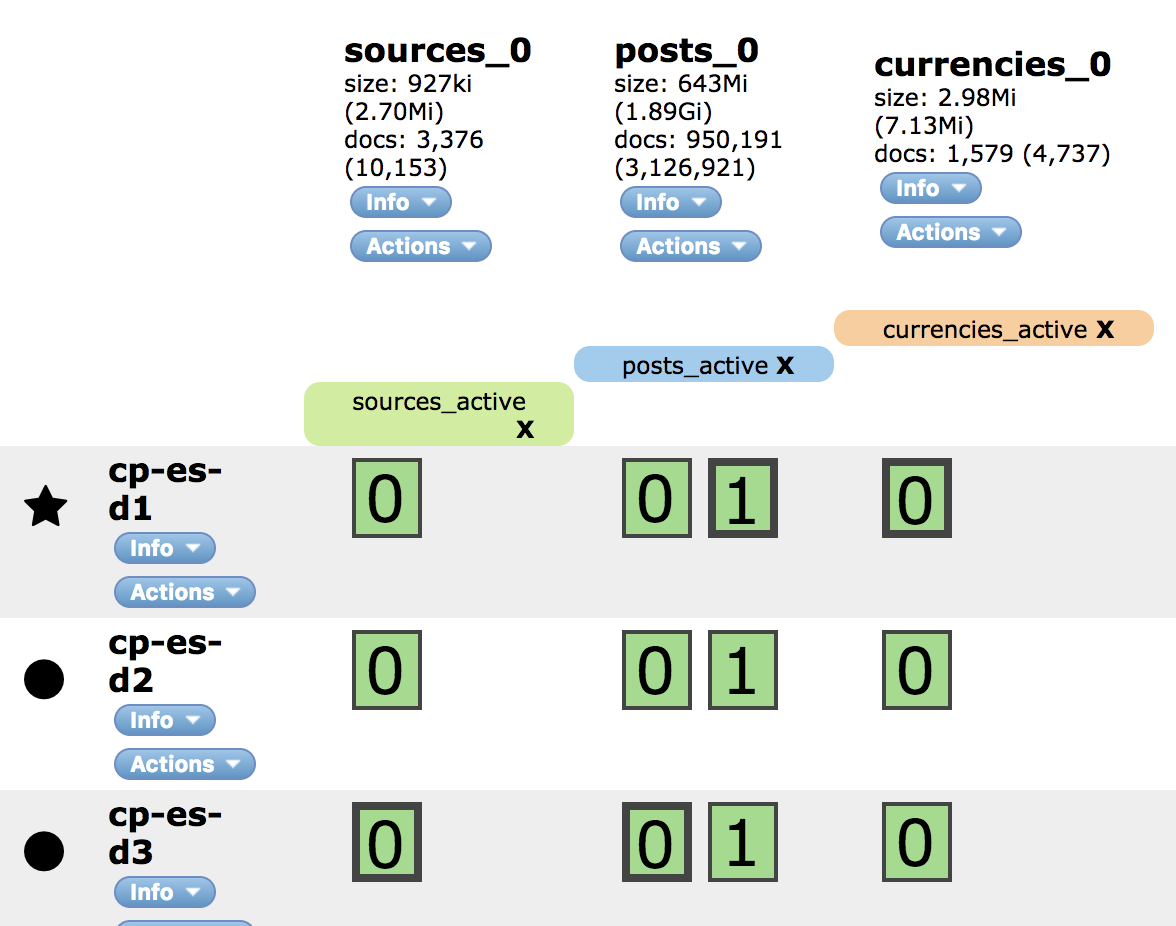
- There are two really tiny indices and one larger one, but still relatively small, which is why I chose c5.large instances, because index is small, but there are lot of search requests and c5.large are computed optimised and 3.6 GB total ram should be enough (full stats below in image).
- Tiny indices have 2 shards + 2 replicas, the one larger one - 3 shards + 2
Problem:
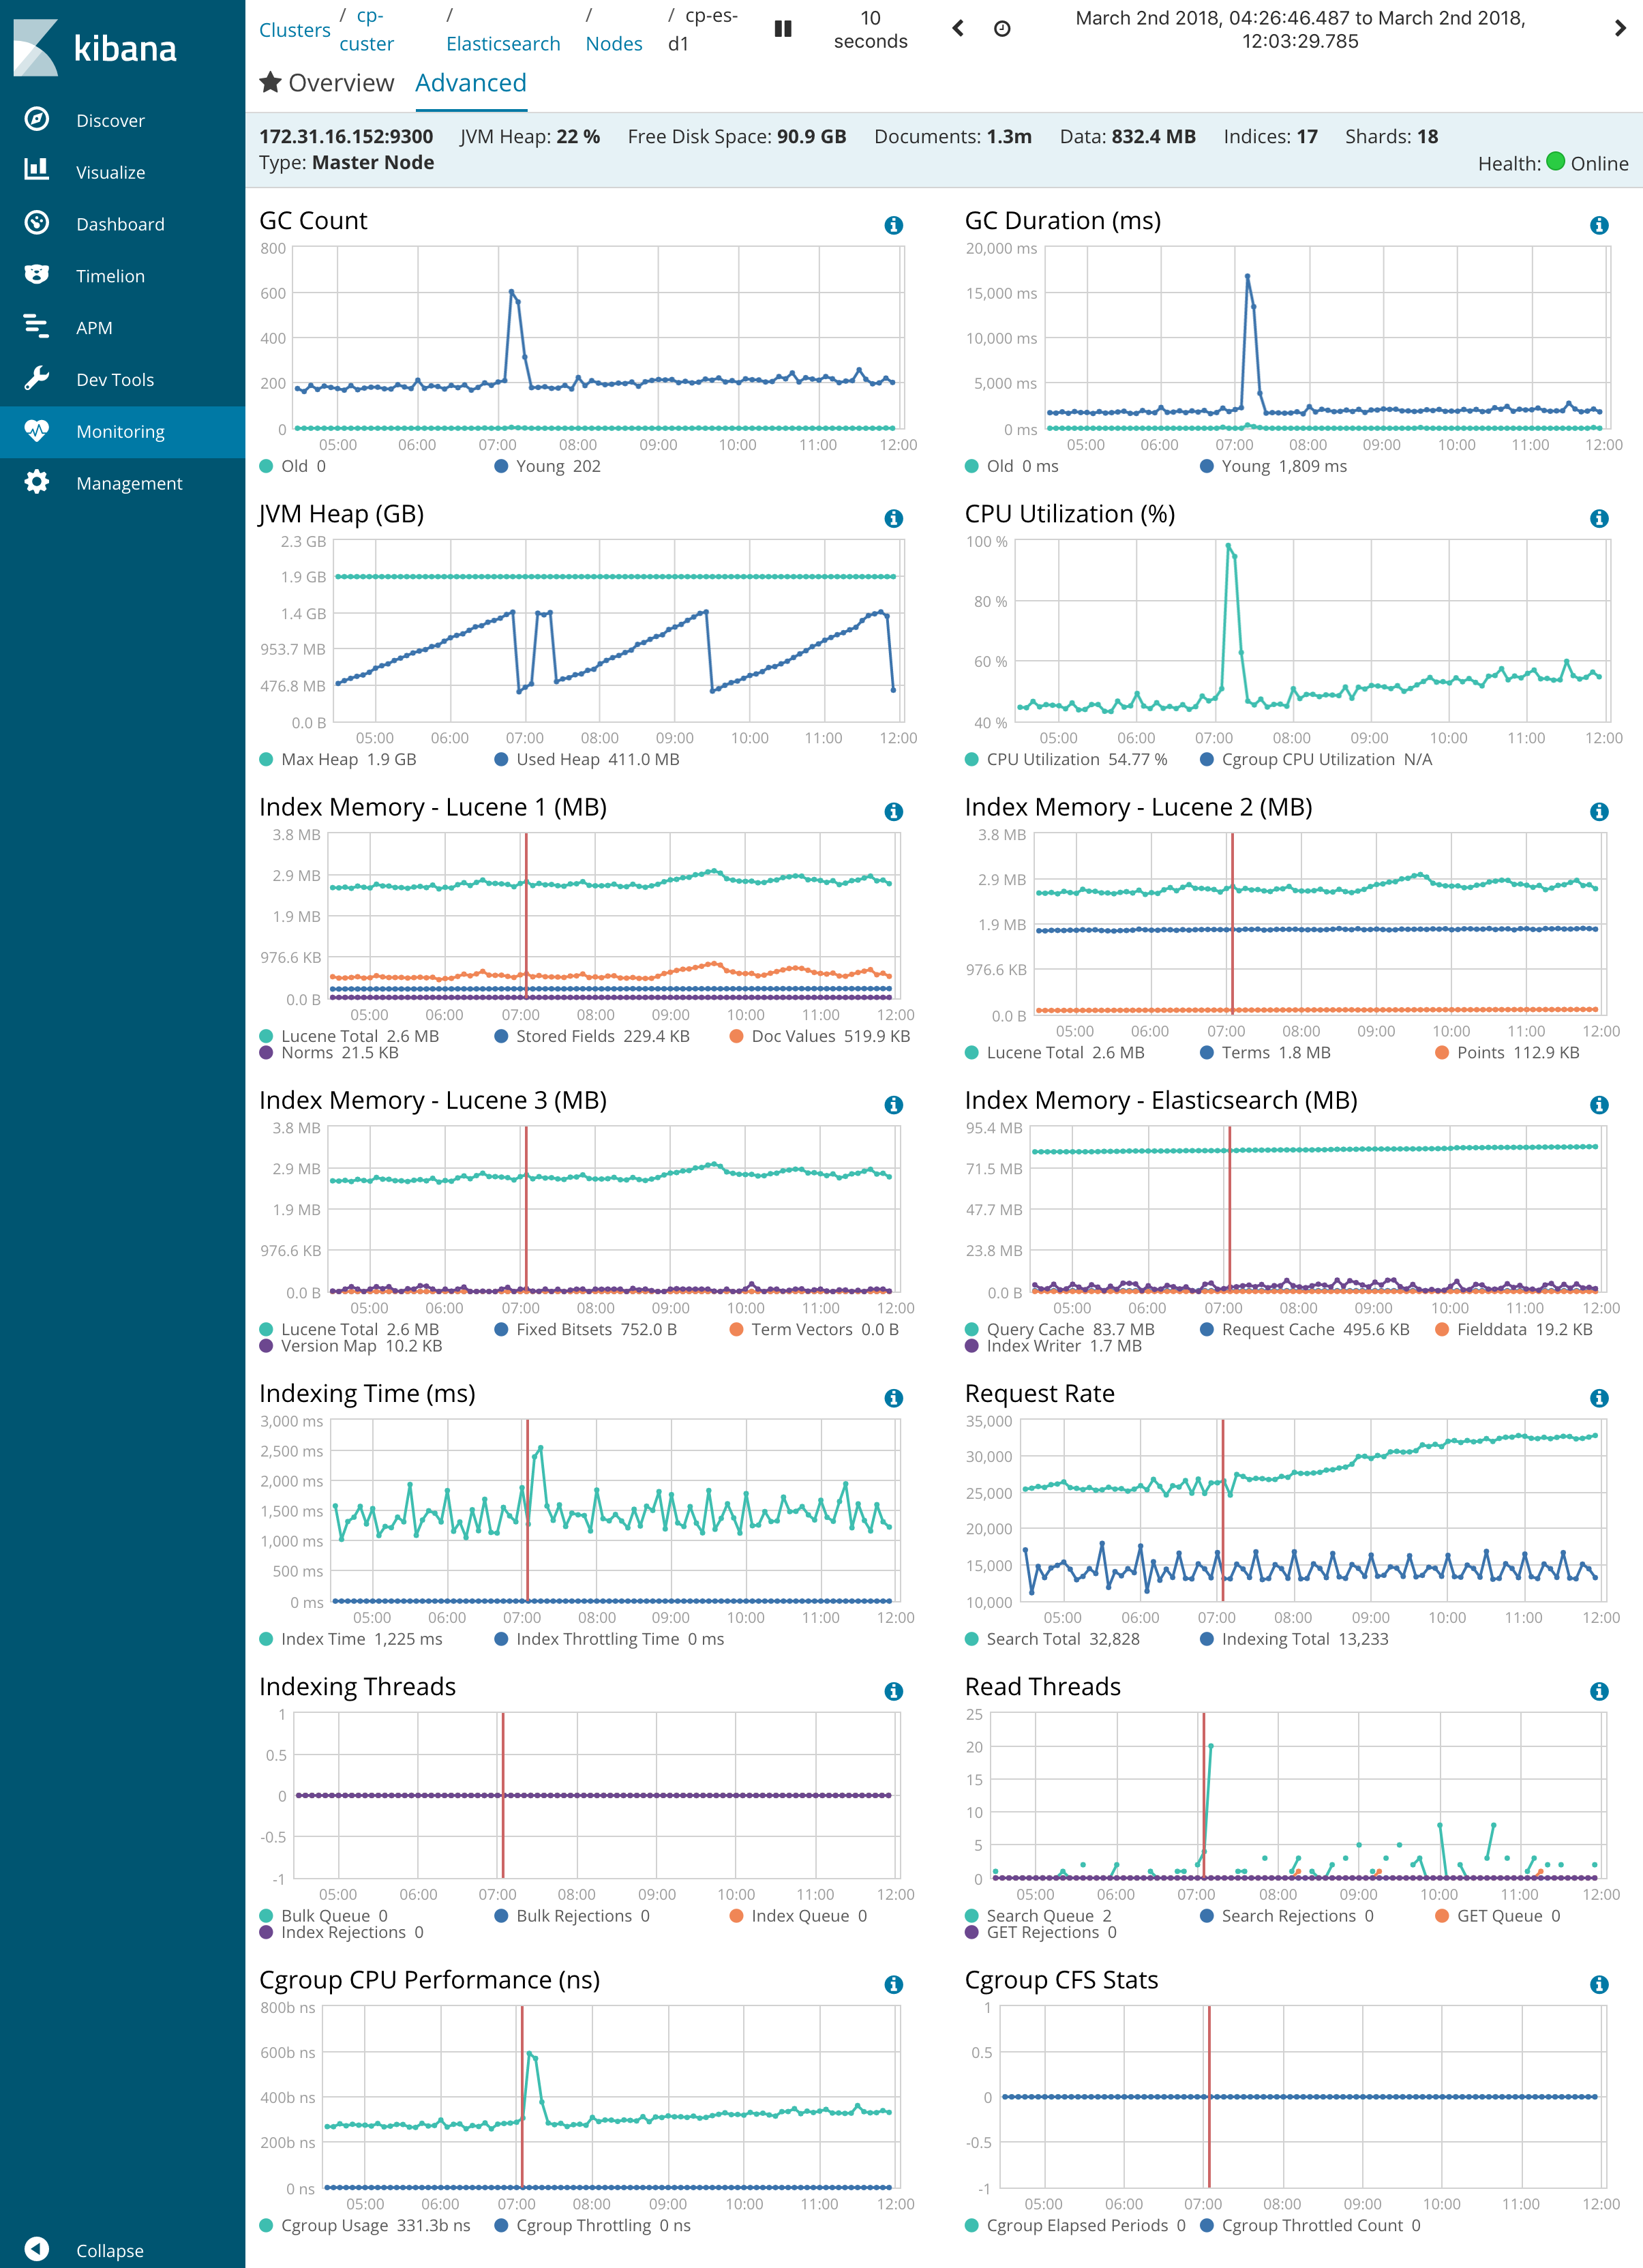
Performance is always perfect, but then out of nowhere, without any extra traffic there are sudden spikes to CPU 100% in all nodes with degrading performance and response times 10 seconds and more. Default logging shows nothing that can relate to this, also nothing on syslog. There is no external traffic increase to nodes when spikes occurs, quite opposite, it was most calm time of the day. But I see proportional increase of Network OUT traffic between nodes. I tried tweaking indices.fielddata.cache.size setting to 25% but still having spikes. All three nodes are behind AWS load balancer and are not exposed to public, but available only through load balancer and routed randomly and available only directly to EC2 instances.
Could anyone please help with figuring reasons or give some hints what I should I look for more? Or what extra logging (default settings) should I enable in order to get more info.
More data and screens:
docker-compose.yml:
version: "3.4"
services:
  elastic:
    environment:
      - NODE_HOSTNAME=${NODE_HOSTNAME}
      - "ES_JAVA_OPTS=-Xms1920m -Xmx1920m"
    ulimits:
      memlock:
        soft: -1
        hard: -1
    volumes:
      - esdata1:/usr/share/elasticsearch/data
    network_mode: host
    ports:
      - 9200:9200
      - 9300:9300
    healthcheck:
      test: "curl --silent --fail localhost:9200/_cluster/health?wait_for_status=yellow&timeout=50s || exit 1"
      interval: 1m30s
      timeout: 50s
      retries: 5
volumes:
  esdata1:
    driver: local
elasticsearch.yml
cluster.name: cp-custer
node.name: ${NODE_HOSTNAME}
action.destructive_requires_name: true

http.cors.enabled: true
http.cors.allow-origin: "*"

node.data: true
node.master: true

bootstrap.memory_lock: true
xpack.security.enabled: false

discovery.zen.hosts_provider: ec2
discovery.zen.minimum_master_nodes: 2
discovery.zen.ping_timeout: 60s
discovery.zen.fd.ping_retries: 20

network.host: 0.0.0.0
network.publish_host: _ec2:privateIp_

discovery.ec2.host_type: private_ip
discovery.ec2.availability_zones: us-east-1b,us-east-1c,us-east-1d
discovery.ec2.endpoint: ec2.us-east-1.amazonaws.com
discovery.ec2.protocol: https
discovery.ec2.groups: sg-xxxxxx

cloud.node.auto_attributes: true
cluster.routing.allocation.awareness.attributes: aws_availability_zone

plugin.mandatory:
  - discovery-ec2

#
# Performance tweaking
#
indices.fielddata.cache.size: 25%
Cluster:
Kibana overview:

Node stats:

Kibana Node stats during CPU spike: cp-es-d1
Kibana Node stats during CPU spike: cp-es-d2

Kibana Node stats during CPU spike: cp-es-d3

Indices stats during CPU spike:

Cluster overview stats during CPU spike:
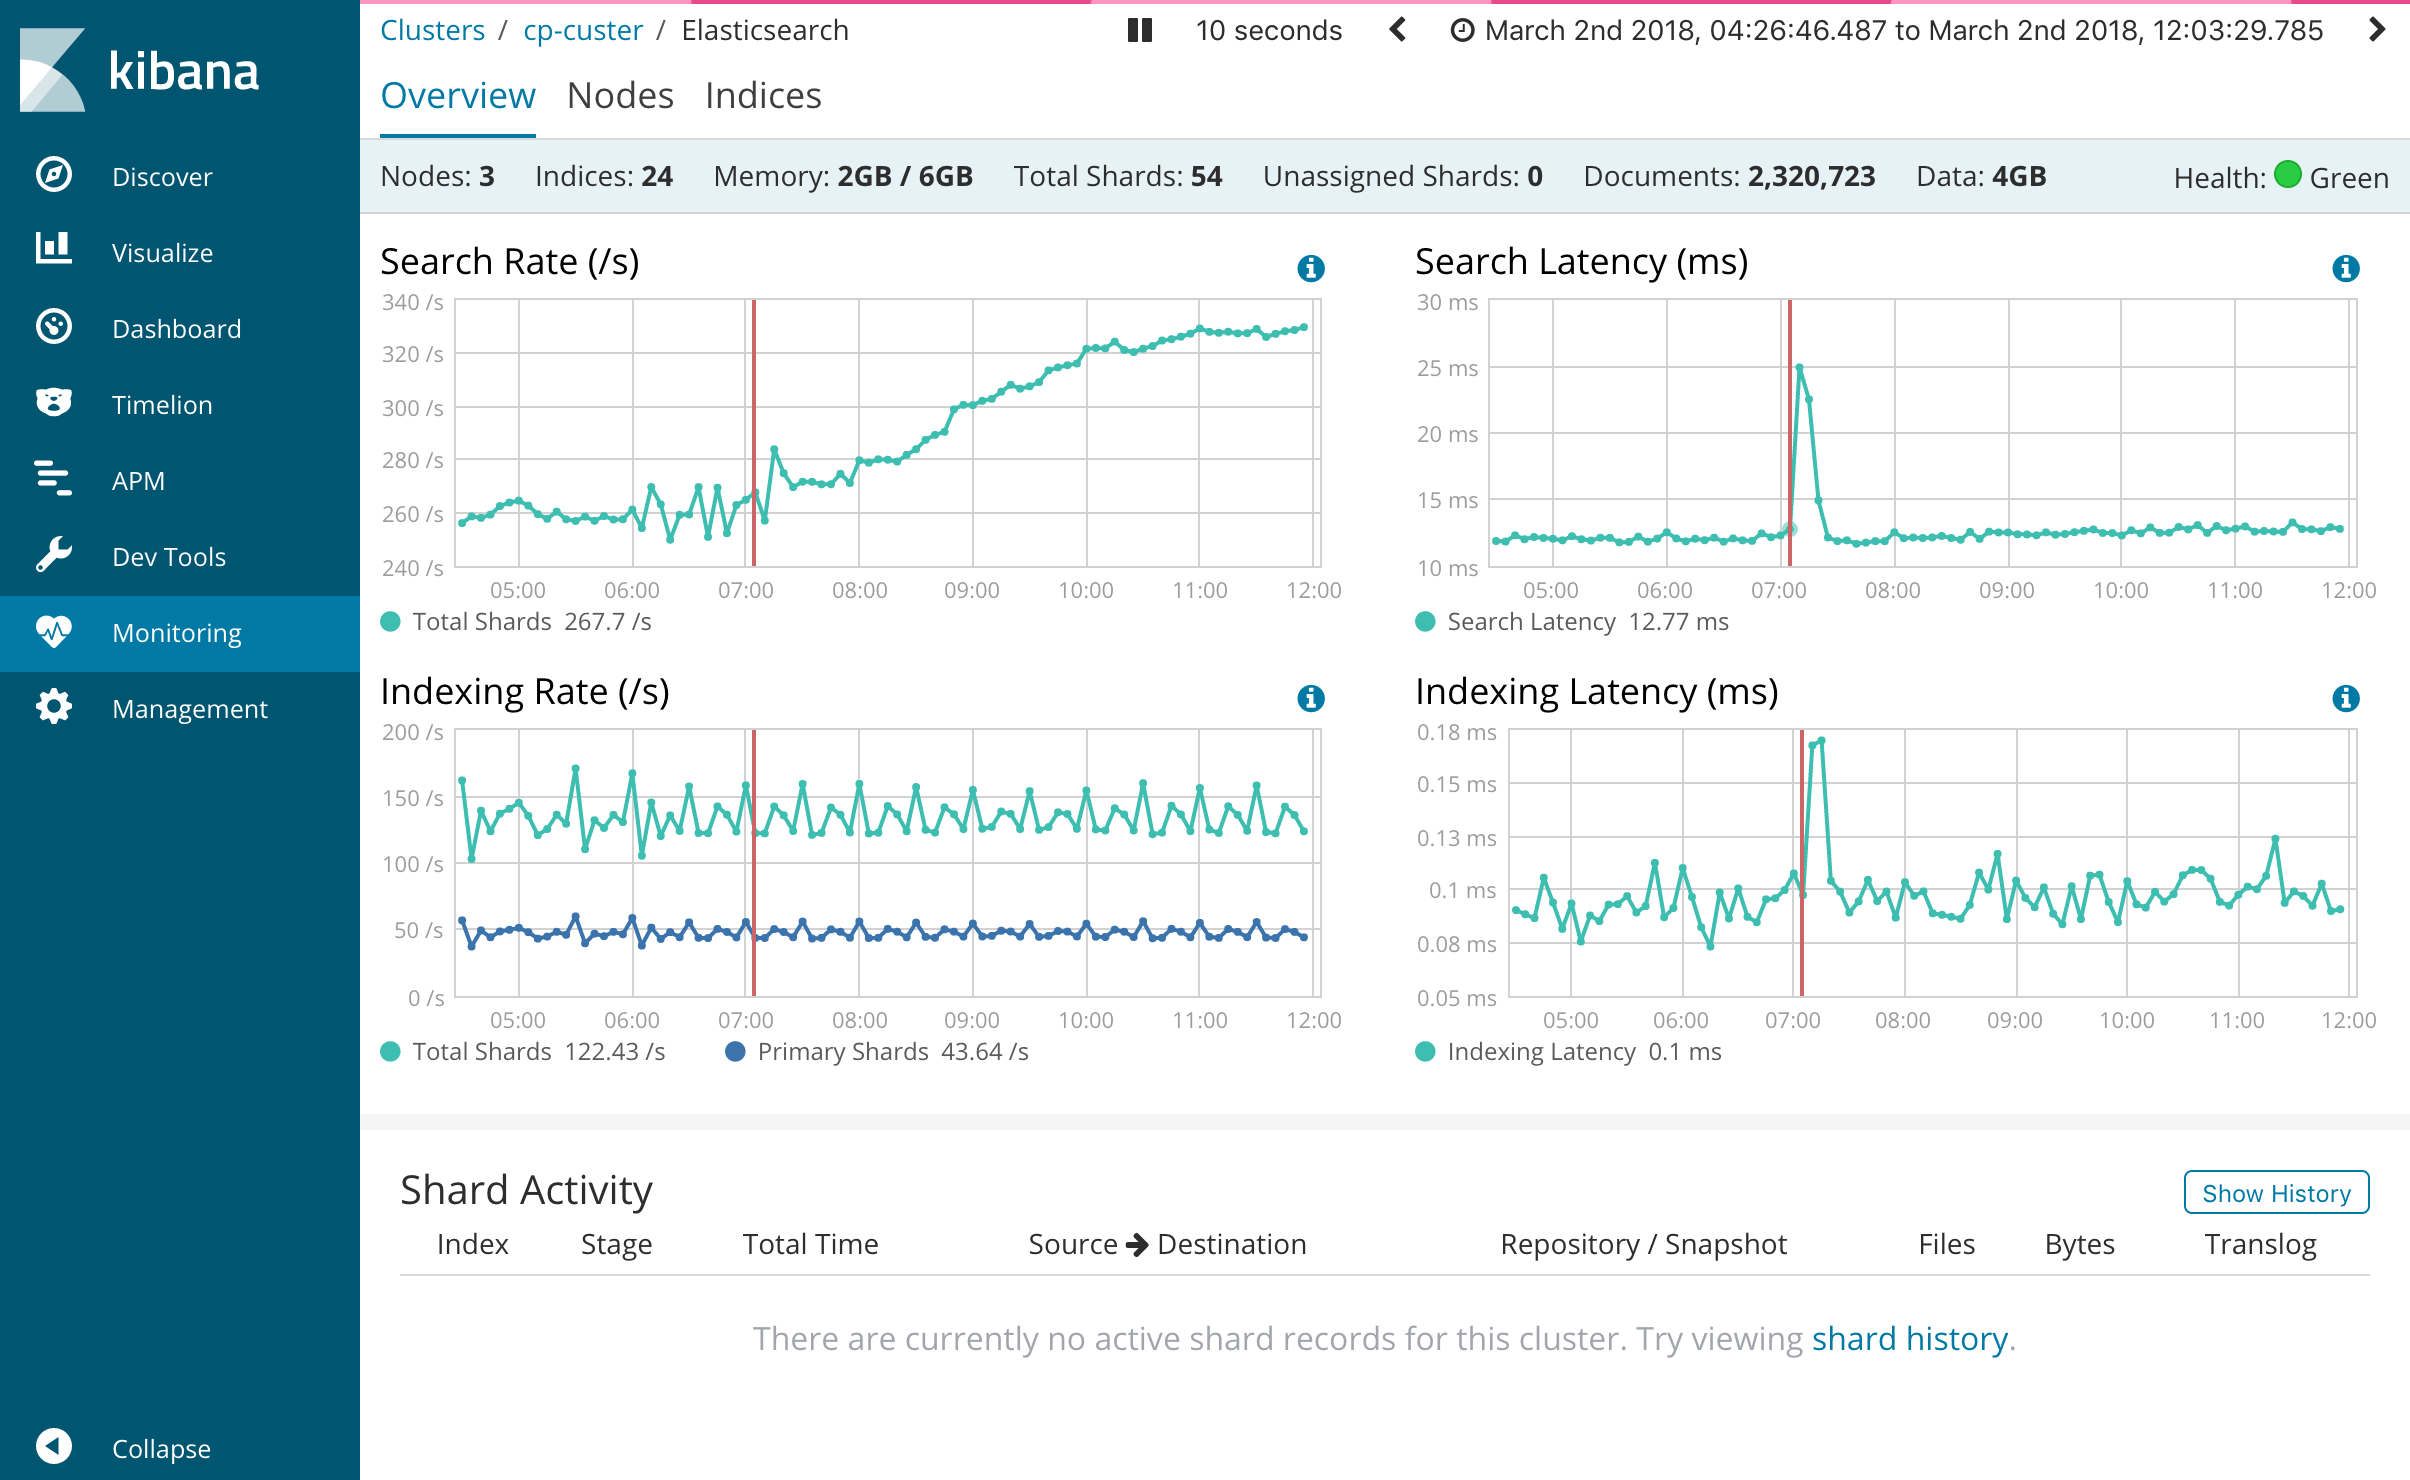
Here are screens from AWS Cloudwatch and only proportional increase to CPU load was Network OUT. But external traffic, load balancer traffic and requests count in Kibana chart shows no increase in any traffic:


Thank you.