Hi,
We have 10 nodes based on ES 5.6.4, and each node 8Core, 8GB memory. The cluster only have one index with 10 shards 1 replica. Each shard has around 180GB data (single big shard is a history issue).
One day, cluster got a few bulk reject errors, each node's heap memory used up to around 80%, after manually triggered old gc, the memory still cannot be reduced. We dumped one of the node's memory, and rolling restarted all the nodes, cluster got recovered, and each node's memory usage stable at around 20%.
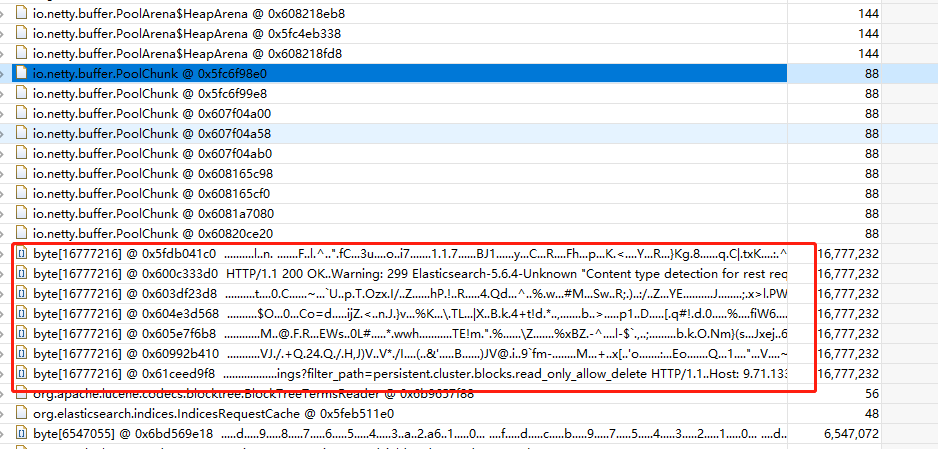
From the dumped file, we found most of the memory used by netty pool cache.
257 netty pool chunks, each chunk is 16MB, total around 4GB:

Here is the GC root path of byte, only kept strong reference:

Why the bulk thread local buffer cache cannot be released? Any idea about the huge memory consumption?
Thanks,
Howard
Any feedback is appreciate!
Any comment is appreciate!
I am not the right person to look at this, but I suspect it would help if you could provide your Elasticsearch config as well as any non-default JVM settings you are using.
What type of load is the cluster under? What is the use-case?
Thank you @Christian_Dahlqvist ,
Here is our es config:
cluster.routing.allocation.disk.include_relocations: false
node.ingest: true
indices.memory.index_buffer_size: 15%
path.data: /data1/containers/1539769914008324911/es/data
processors: 8
node.name: 1539769914008324911
search.remote.connect: false
indices.queries.cache.count: 500
bootstrap.seccomp: false
action.destructive_requires_name: true
indices.queries.cache.size: 5%
cluster.routing.allocation.awareness.attributes: ip
cluster.routing.allocation.disk.watermark.low: 90%
ingest.new_date_format: true
discovery.zen.minimum_master_nodes: 6
http.port: 9200
cluster.routing.allocation.disk.watermark.high: 95%
node.master: true
thread_pool.bulk.queue_size: 230
node.data: true
network.publish_host: 100.125.51.15
node.attr.ip: 100.125.51.15
network.host: 0.0.0.0
cluster.name: Lambda
discovery.zen.ping.unicast.hosts: [ten nodes ip:port list]
And except xms/xmx, we don't have non-default JVM settings:
-Xms7896m
-Xmx7896m
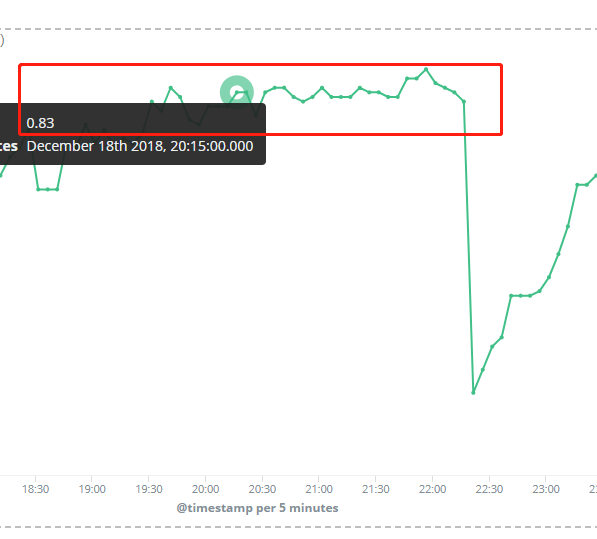
Here is the average JVM usage for each node during that time, and eacho node cpu utilization around 20%. After rolling restart nodes, jvm usage comes down.
Cluster has single index with 10 shards 1 replica:
green open lambda 68_xZphGTG6aGhXhQsjcYw 10 1 1754643122 2859 1.8tb 1.8tb
And we could see some bulk reject, and node memory cannot be reduced by old gc, it's used up by netty pool buffer as above description.
Thanks,
Howard
What is the average size of your documents? What is the average size of your bulk requests? How many shards are you actively indexing into?
Thank you @Christian_Dahlqvist , average size of doc is 5kb, and average bulk size is 5000, the target index has 10 primary shards and each shard has one replica, total 20 shards.
Currently cluster runs correct without exception, I also dumped current memory for analysising. I found less then 10 bytes array which contains netty pool chunk.
But in previous exception case, dump one node has around 500 netty pool chunk bytes array which used up more than 4GB heap. (total heap size 8GB)
