Hi, community,
I hope this message finds you well. I'm seeking assistance with a logging issue in my setup, and I apologize if I've included an excess of logs or configurations in this post.
My current logging pipeline involves Filebeat -> Logstash -> Elasticsearch for shipping and storing logs.
Let me illustrate the situation with a sample log:
2023-12-28 10:00:19.618 DEBUG 7 --- [http-nio-8080-exec-4] c.s.i.a.a.AsymmetricAuthenticationFilter : Ignoring non-lifecycle endpoint
After applying a Grok pattern, the log is successfully filtered into a structured format:
{
  "thread_name": "http-nio-8080-exec-4",
  "loglevel": "DEBUG",
  "thread": "7",
  "message": "Ignoring non-lifecycle endpoint",
  "class": "c.s.i.a.a.AsymmetricAuthenticationFilter",
  "timestamp": "2023-12-28 10:00:19.618"
}
Data view In the kibana:
The full value:
{
  "@timestamp": [
    "2023-12-28T02:00:27.736Z"
  ],
  "@version": [
    "1"
  ],
  "@version.keyword": [
    "1"
  ],
  "agent.ephemeral_id": [
    "5f6dc004-6d55-4cd1-8d14-e9f43a3cde96"
  ],
  "agent.ephemeral_id.keyword": [
    "5f6dc004-6d55-4cd1-8d14-e9f43a3cde96"
  ],
  "agent.id": [
    "e033434e-e85e-4f1f-be87-4e6c25164aa0"
  ],
  "agent.id.keyword": [
    "e033434e-e85e-4f1f-be87-4e6c25164aa0"
  ],
  "agent.name": [
    "jira-addon-helm-release-59746f94b5-6khkk"
  ],
  "agent.name.keyword": [
    "jira-addon-helm-release-59746f94b5-6khkk"
  ],
  "agent.type": [
    "filebeat"
  ],
  "agent.type.keyword": [
    "filebeat"
  ],
  "agent.version": [
    "8.11.3"
  ],
  "agent.version.keyword": [
    "8.11.3"
  ],
  "class": [
    "c.s.i.a.a.AsymmetricAuthenticationFilter"
  ],
  "class.keyword": [
    "c.s.i.a.a.AsymmetricAuthenticationFilter"
  ],
  "ecs.version": [
    "8.0.0"
  ],
  "ecs.version.keyword": [
    "8.0.0"
  ],
  "event.original": [
    "2023-12-28 10:00:19.618 DEBUG 7 --- [http-nio-8080-exec-4] c.s.i.a.a.AsymmetricAuthenticationFilter : Ignoring non-lifecycle endpoint"
  ],
  "event.original.keyword": [
    "2023-12-28 10:00:19.618 DEBUG 7 --- [http-nio-8080-exec-4] c.s.i.a.a.AsymmetricAuthenticationFilter : Ignoring non-lifecycle endpoint"
  ],
  "host.architecture": [
    "x86_64"
  ],
  "host.architecture.keyword": [
    "x86_64"
  ],
  "host.containerized": [
    true
  ],
  "host.hostname": [
    "jira-addon-helm-release-59746f94b5-6khkk"
  ],
  "host.hostname.keyword": [
    "jira-addon-helm-release-59746f94b5-6khkk"
  ],
  "host.ip": [
    "10.244.5.15",
    "fe80::30d8:cff:fee6:8780"
  ],
  "host.ip.keyword": [
    "10.244.5.15",
    "fe80::30d8:cff:fee6:8780"
  ],
  "host.mac": [
    "32-D8-0C-E6-87-80"
  ],
  "host.mac.keyword": [
    "32-D8-0C-E6-87-80"
  ],
  "host.name": [
    "jira-addon-helm-release-59746f94b5-6khkk"
  ],
  "host.name.keyword": [
    "jira-addon-helm-release-59746f94b5-6khkk"
  ],
  "host.os.codename": [
    "focal"
  ],
  "host.os.codename.keyword": [
    "focal"
  ],
  "host.os.family": [
    "debian"
  ],
  "host.os.family.keyword": [
    "debian"
  ],
  "host.os.kernel": [
    "3.10.0-1160.90.1.el7.x86_64"
  ],
  "host.os.kernel.keyword": [
    "3.10.0-1160.90.1.el7.x86_64"
  ],
  "host.os.name": [
    "Ubuntu"
  ],
  "host.os.name.keyword": [
    "Ubuntu"
  ],
  "host.os.platform": [
    "ubuntu"
  ],
  "host.os.platform.keyword": [
    "ubuntu"
  ],
  "host.os.type": [
    "linux"
  ],
  "host.os.type.keyword": [
    "linux"
  ],
  "host.os.version": [
    "20.04.6 LTS (Focal Fossa)"
  ],
  "host.os.version.keyword": [
    "20.04.6 LTS (Focal Fossa)"
  ],
  "input.type": [
    "filestream"
  ],
  "input.type.keyword": [
    "filestream"
  ],
  "log.file.device_id": [
    "64768"
  ],
  "log.file.device_id.keyword": [
    "64768"
  ],
  "log.file.inode": [
    "1651961984"
  ],
  "log.file.inode.keyword": [
    "1651961984"
  ],
  "log.file.path": [
    "/home/web/jiraAddon/logs/jira-addon-helm-release-59746f94b5-6khkk/spring.log"
  ],
  "log.file.path.keyword": [
    "/home/web/jiraAddon/logs/jira-addon-helm-release-59746f94b5-6khkk/spring.log"
  ],
  "log.offset": [
    4937
  ],
  "loglevel": [
    "DEBUG"
  ],
  "loglevel.keyword": [
    "DEBUG"
  ],
  "message": [
    "Ignoring non-lifecycle endpoint"
  ],
  "message.keyword": [
    "Ignoring non-lifecycle endpoint"
  ],
  "tags": [
    "beats_input_codec_plain_applied"
  ],
  "tags.keyword": [
    "beats_input_codec_plain_applied"
  ],
  "thread": [
    "7"
  ],
  "thread_name": [
    "http-nio-8080-exec-4"
  ],
  "thread_name.keyword": [
    "http-nio-8080-exec-4"
  ],
  "thread.keyword": [
    "7"
  ],
  "timestamp": [
    "2023-12-28T10:00:19.618Z"
  ],
  "_id": "EMMmrowBFaHQjyBw0Tq3",
  "_index": "jira-addon-springlog-2023.12.28",
  "_score": null
}
So from this point, everything is OK. The timestamp is the right value. However, when I apply the field in the data view, the timestamp field went wrong:
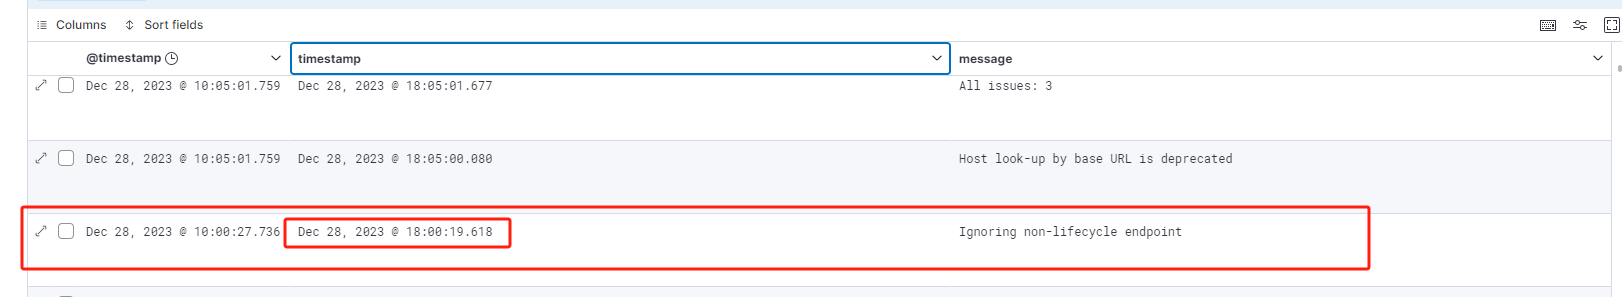
It supposed to be 2023-12-28T10:00:19.618Z but now it is Dec 28, 2023 @ 18:00:19.618
Here are my filebeat and logstash configs:
fileabeat.yaml:
filebeat.inputs:
- type: filestream
  id: my-filestream-id
  enabled: true
  paths:
    - /home/web/jiraAddon/logs/*/*.log

filebeat.config.modules:
  path: ${path.config}/modules.d/*.yml
  reload.enabled: false
setup.template.settings:
  index.number_of_shards: 1

setup.kibana:
  host: "192.168.38.88:5601"
  username: "xxxxx"
  password: "xxxxxxx"

output.logstash:
  hosts: ["192.168.38.88:5044"]
processors:
  - add_host_metadata:
      when.not.contains.tags: forwarded
  - add_cloud_metadata: ~
  - add_docker_metadata: ~
  - add_kubernetes_metadata: ~
  - add_id: ~
logstash config:
input
{
    beats{
        port => 5044
    }
}


filter
{
  grok {
    match => { "message" => "%{TIMESTAMP_ISO8601:timestamp}\s+%{LOGLEVEL:loglevel}\s+%{NUMBER:thread}\s+---\s+\[%{DATA:thread_name}\]\s+%{DATA:class}\s+: %{GREEDYDATA:message}" }
    overwrite => [ "message" ]
  }

  if [timestamp] {
    date {
      match => [ "timestamp", "ISO8601" ]
      target => "timestamp"
    }
  }

  if ![loglevel]{
    grok{

      mutate { add_field => { "loglevel" => "text"  }  }
    }
  }


}

output
{
  if [@metadata][_id]{
    elasticsearch{
        hosts => ["https://192.168.38.88:9200"]
        #document_id => "%{[@metadata][_id]}"
        ssl => true
        user => xxxxx
        password => xxxxxx
        index => "jira-addon-springlog-%{+YYYY.MM.dd}"
        cacert => "/usr/share/logstash/certs/ca/ca.crt"
    }
  }else{
    elasticsearch{
      hosts => ["https://192.168.38.88:9200"]
      ssl => true
      user => xxxxxx
      password => xxxxxxx
      index => "jira-addon-logtest-without-document-id"
      cacert => "/usr/share/logstash/certs/ca/ca.crt" #cacert
    }
  }
    stdout{ codec => rubydebug {metadata => true} }
}
Best Regards,
Longkang.
