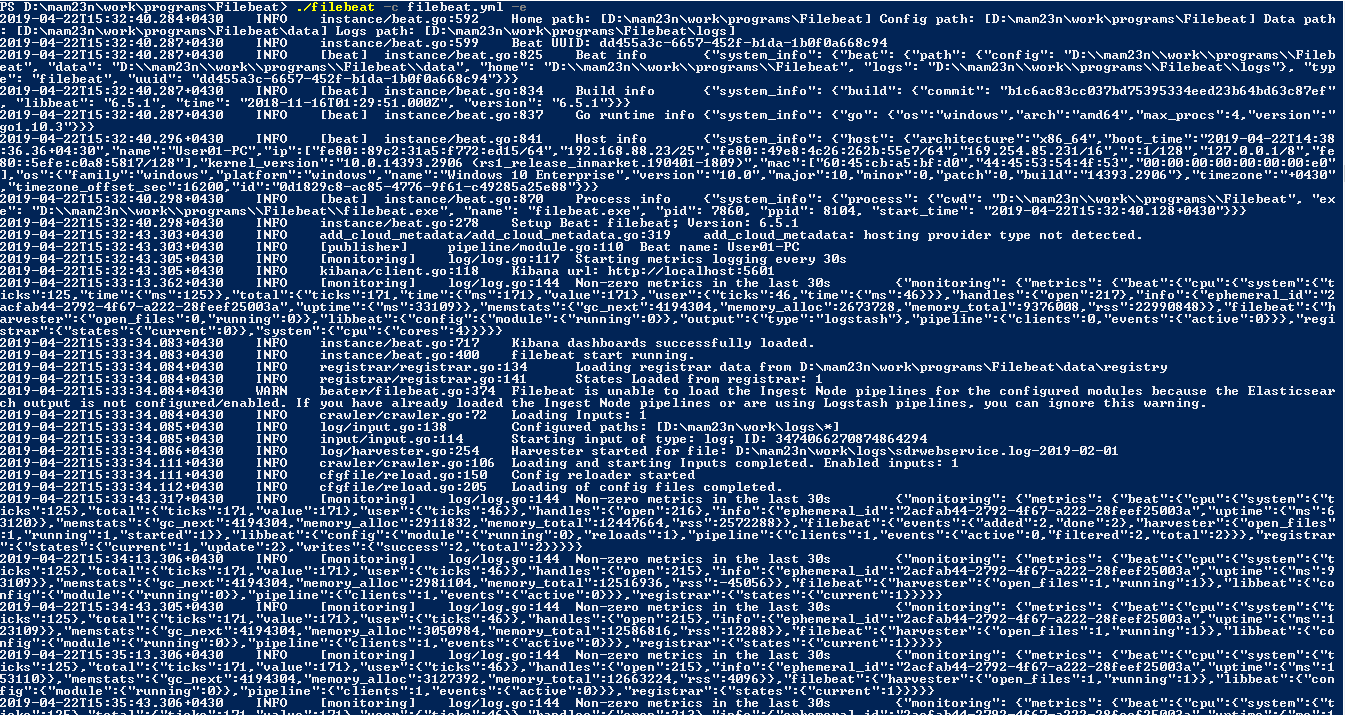
and it is keep going with same messages and doesn't stop.
and this is my filebeat.yml:
#=========================== Filebeat inputs =============================

filebeat.inputs:

# Each - is an input. Most options can be set at the input level, so
# you can use different inputs for various configurations.
# Below are the input specific configurations.

- type: log

# Change to true to enable this input configuration.
enabled: true

# Paths that should be crawled and fetched. Glob based paths.
paths:
- D:\mam23n\work\logs\*


#============================= Filebeat modules ===============================

filebeat.config.modules:
# Glob pattern for configuration loading
path: ${path.config}/modules.d/*.yml

# Set to true to enable config reloading
reload.enabled: false

# Period on which files under path should be checked for changes
#reload.period: 10s

#==================== Elasticsearch template setting ==========================

setup.template.settings:
index.number_of_shards: 3
#index.codec: best_compression
#_source.enabled: false


#============================== Dashboards =====================================
# These settings control loading the sample dashboards to the Kibana index. Loading
# the dashboards is disabled by default and can be enabled either by setting the
# options here, or by using the `-setup` CLI flag or the `setup` command.
setup.dashboards.enabled: true
# setup.dashboards.directory: D:\mam23n\work\programs\kibana-6.5.1-windows-x86_64
# The URL from where to download the dashboards archive. By default this URL
# has a value which is computed based on the Beat name and version. For released
# versions, this URL points to the dashboard archive on the artifacts.elastic.co
# website.
#setup.dashboards.url:

#============================== Kibana =====================================

# Starting with Beats version 6.0.0, the dashboards are loaded via the Kibana API.
# This requires a Kibana endpoint configuration.
setup.kibana:

# Kibana Host
# Scheme and port can be left out and will be set to the default (http and 5601)
# In case you specify and additional path, the scheme is required: http://localhost:5601/path
# IPv6 addresses should always be defined as: https://[2001:db8::1]:5601
host: "localhost:5601"


#----------------------------- Logstash output --------------------------------
output.logstash:
# The Logstash hosts
hosts: ["localhost:5044"]

# Optional SSL. By default is off.
# List of root certificates for HTTPS server verifications
#ssl.certificate_authorities: ["/etc/pki/root/ca.pem"]

# Certificate for SSL client authentication
#ssl.certificate: "/etc/pki/client/cert.pem"

# Client Certificate Key
#ssl.key: "/etc/pki/client/cert.key"

#================================ Procesors =====================================

# Configure processors to enhance or manipulate events generated by the beat.

processors:
- add_host_metadata: ~
- add_cloud_metadata: ~
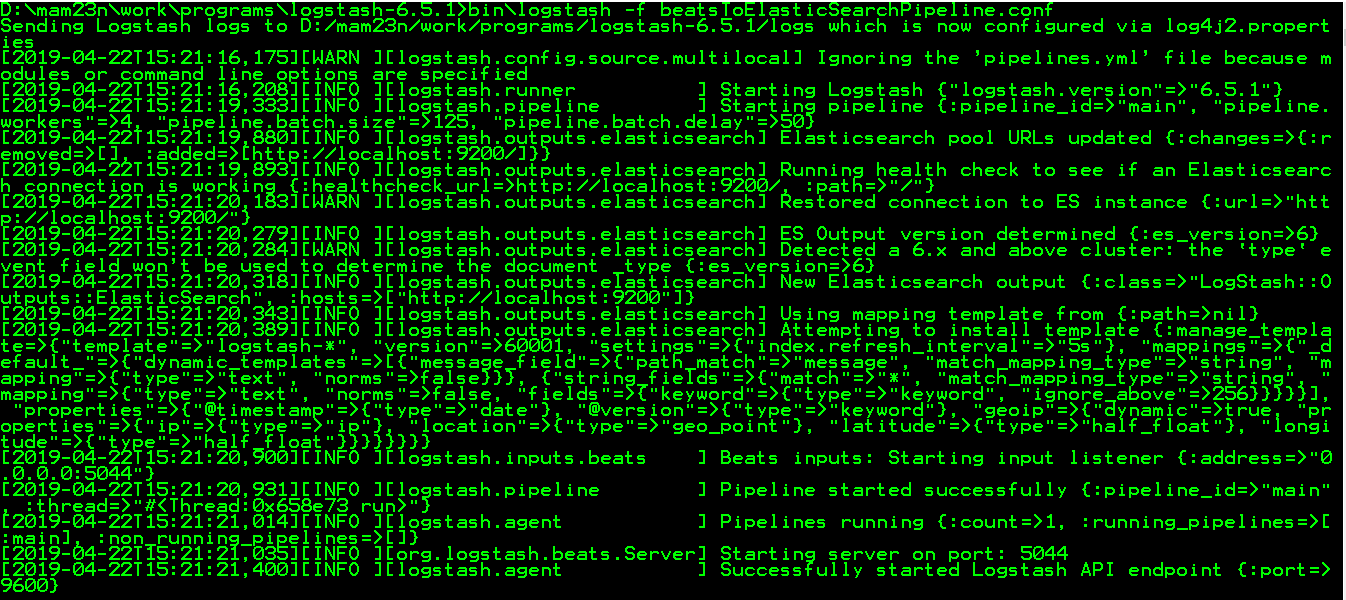
I checked filebeat logs and there is no error there.
thanks for your help
Filebeat tails files. It keeps track of last published locations in the registry file. Stop filebeat, delete registry, restart filebeat forces it to send the same file again. Or append new log lines.
@Mohammad_hossein_Taj, What you have shared as filebeat config file have lots of indentation problems. I have checked with your given filebeat.yml and I am getting lots of error due to indentation problem.
Enable debug log also to see the event is prepared or not.
Kindly find the below reference config file
#=========================== Filebeat inputs =============================

filebeat.inputs:

# Each - is an input. Most options can be set at the input level, so
# you can use different inputs for various configurations.
# Below are the input specific configurations.

- type: log

# Change to true to enable this input configuration.
  enabled: true

# Paths that should be crawled and fetched. Glob based paths.
  paths:
     - D:\mam23n\work\logs\*


#============================= Filebeat modules ===============================

filebeat.config.modules:
# Glob pattern for configuration loading
  path: ${path.config}/modules.d/*.yml

# Set to true to enable config reloading
  reload.enabled: false

# Period on which files under path should be checked for changes
#reload.period: 10s

#==================== Elasticsearch template setting ==========================

setup.template.settings:
  index.number_of_shards: 3
#index.codec: best_compression
#_source.enabled: false


#============================== Dashboards =====================================
# These settings control loading the sample dashboards to the Kibana index. Loading
# the dashboards is disabled by default and can be enabled either by setting the
# options here, or by using the `-setup` CLI flag or the `setup` command.
setup.dashboards.enabled: true
# setup.dashboards.directory: D:\mam23n\work\programs\kibana-6.5.1-windows-x86_64
# The URL from where to download the dashboards archive. By default this URL
# has a value which is computed based on the Beat name and version. For released
# versions, this URL points to the dashboard archive on the artifacts.elastic.co
# website.
#setup.dashboards.url:

#============================== Kibana =====================================

# Starting with Beats version 6.0.0, the dashboards are loaded via the Kibana API.
# This requires a Kibana endpoint configuration.
setup.kibana:

# Kibana Host
# Scheme and port can be left out and will be set to the default (http and 5601)
# In case you specify and additional path, the scheme is required: http://localhost:5601/path
# IPv6 addresses should always be defined as: https://[2001:db8::1]:5601
  host: "localhost:5601"


#----------------------------- Logstash output --------------------------------
output.logstash:
# The Logstash hosts
  hosts: ["localhost:5044"]

# Optional SSL. By default is off.
# List of root certificates for HTTPS server verifications
#ssl.certificate_authorities: ["/etc/pki/root/ca.pem"]

# Certificate for SSL client authentication
#ssl.certificate: "/etc/pki/client/cert.pem"

# Client Certificate Key
#ssl.key: "/etc/pki/client/cert.key"

#================================ Procesors =====================================

# Configure processors to enhance or manipulate events generated by the beat.

processors:
  - add_host_metadata: ~
  - add_cloud_metadata: ~

logging.level: debug
logging.selectors: ["*"]
Now If your complete configuration (like kibana, processors etc.) is as per your requirement and they are fine then kindly check the entry of registry file under "/var/lib/filebeat/registry".
As you have said that you have already send the data previously so may be there is an entry of your harvesting file in registry.
So to send the same data you have to remove the registry entry. If you want to send new data then append some log inside the log file.
Apache, Apache Lucene, Apache Hadoop, Hadoop, HDFS and the yellow elephant
logo are trademarks of the
Apache Software Foundation
in the United States and/or other countries.