Tile Map disappears

Hi,

I have a dashboard where i want to show consumption of devices in different areas within the city
Version of ES/Kibana/logstash - 5.3.0

I have uploaded single index with different type of data from various csv files such as:
type1 = meters
type2 = alarms
type3 = maps

Now all three types have 2 common fields
field1 = device_name
field2 = unique_device_ID

Now when i create multiple visualizations, and while clicking on one of the PIE chart for example:
Unique count of field2 showing consumption > 0

Then my maps goes off (if doesn't say no results found) and blank on my dashboard.
Even though i have Unique count of field2 defined in the tile map viz.
All my other viz work as expected, except the map.

Need Help:
Is there any way we could link the maps when we apply a query or drill down to visualization

Hi @karnamonkster

I'm having a hard time visualizing exactly what's happening. Could you provide some screenshots or perhaps an animated gif to show what's going on?

Hi Matt,

Here are the two images that i managed to snap.

  1. maps

  2. consumption

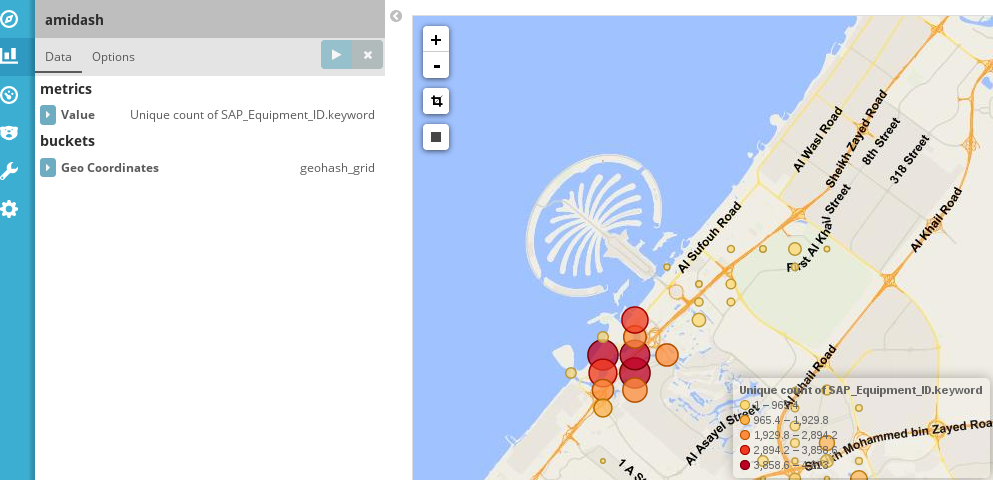
Now when i port it in the dashboard, and on clicking the pie chart for say "negative consumption, the map goes off, however you can see they are within the same index and a common field - SAP_Equipment_ID is used as unique count.

does that help?

When you say the map goes off, do you just mean all the data points disappear?

On the dashboard, you can click on the "spy tab" on the tilemap to look at the raw request and response from ES:

I'd start there and look for anything strange about the request. You can try submitting the raw request in Console and play around with it to see if you can figure out why documents are being returned.

When you say the map goes off, do you just mean all the data points disappear?
the complete visualization goes off as in blank and no map at all in that viz space

let me look at the spy tab and see what can be done.

Ah, sorry I misunderstood. Let us know what you see in the spy panel. Would you also mind posting a screenshot of the dashboard with the the blank map? We haven't seen this behavior before, it may be a bug we need to fix.

cc @thomasneirynck

Hi Matt,

Here is what i have before and after applying filter
Before

After

Is there anyway i can link this with a query or something.
any help will be appreciated

If you click the "Request" tab in the spy panel you can see the actual request with the query that was sent to ES.

Could you also post a screenshot of what the map looks like with the filter applied?

Hi Matt,

I will do that for sure, but just wondering whether this might be the issue
Going back to my initial question -
I have geo maps data like location & etc. in a type3
I have consumption data in type1 & type2

So i think the viz does not work if the data is segregated in different type as rest of the visualization are from single type i.e. type1

Is there a method to query across different types? that should solve the issue i guess or i may be wrong

Hi Matt,

Here you go the actual request from both visualization
PIE CHART

{
  "query": {
    "bool": {
      "must": [
        {
          "query_string": {
            "query": "*",
            "analyze_wildcard": true
          }
        },
        {
          "query_string": {
            "query": "*",
            "analyze_wildcard": true
          }
        },
        {
          "range": {
            "@timestamp": {
              "gte": 1492759058452,
              "lte": 1492759958452,
              "format": "epoch_millis"
            }
          }
        }
      ],
      "must_not": []
    }
  },
  "size": 0,
  "_source": {
    "excludes": []
  },
  "aggs": {
    "2": {
      "filters": {
        "filters": {
          "Zero Consumption": {
            "query_string": {
              "query": "consumption:0",
              "analyze_wildcard": true
            }
          },
          "Negative Consumption": {
            "query_string": {
              "query": "consumption:<0",
              "analyze_wildcard": true
            }
          },
          "Positive Consumption": {
            "query_string": {
              "query": "consumption:>0",
              "analyze_wildcard": true
            }
          }
        }
      },
      "aggs": {
        "1": {
          "cardinality": {
            "field": "SAP_Equipment_ID.keyword"
          }
        }
      }
    }
  }
}

MAPS

{
  "query": {
    "bool": {
      "must": [
        {
          "query_string": {
            "query": "*",
            "analyze_wildcard": true
          }
        },
        {
          "query_string": {
            "query": "*",
            "analyze_wildcard": true
          }
        },
        {
          "range": {
            "@timestamp": {
              "gte": 1492759058452,
              "lte": 1492759958452,
              "format": "epoch_millis"
            }
          }
        }
      ],
      "must_not": []
    }
  },
  "size": 0,
  "_source": {
    "excludes": []
  },
  "aggs": {
    "2": {
      "geohash_grid": {
        "field": "location",
        "precision": 5
      },
      "aggs": {
        "1": {
          "cardinality": {
            "field": "SAP_Equipment_ID.keyword"
          }
        }
      }
    }
  }
}

I think you're on the right track there. If the documents containing location fields do not contain the consumption field, then a filter on the consumption field will filter out all of the location documents. Do you have multiple types for the sake of normalization? If so you may want to consider denormalizing a bit in order to make these types of queries possible. There isn't really a way to join across types.

Hi Matt,
I also tried denormalizing the same using no multiple types and all in all a single index.
Still the problem persists.
I think there is no way out except we wait for " sub aggregations" to be enabled on tile maps

This topic was automatically closed 28 days after the last reply. New replies are no longer allowed.