Hi,
Can I draw time series graph for Filesystem?
In time series only one group by is there in TS visual.
By Using data table visual, I can split the rows using 2 fields, Fs-Mount and Hostname, both are strings . On Y-axis we have Fs-percent ( an integer field).
But in TS visual, I cant do that. I can add more aggregations, but not Group by.
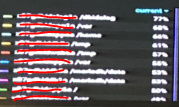
I want % usage on y-axis and at the right side legend, I want to show
"hostname1 FS Mount A N%"
"hostname1 FS Mount B N%"
"hostname2 FS Mount A N%"
"hostname2 FS Mount B N%"
"hostname1 FS Mount X N%"
like this....
red lins are hostname and in front of that there is FS mount. its drawn in grafana. I want same in Kibana.

Please guide me on this.
br,
Sunil