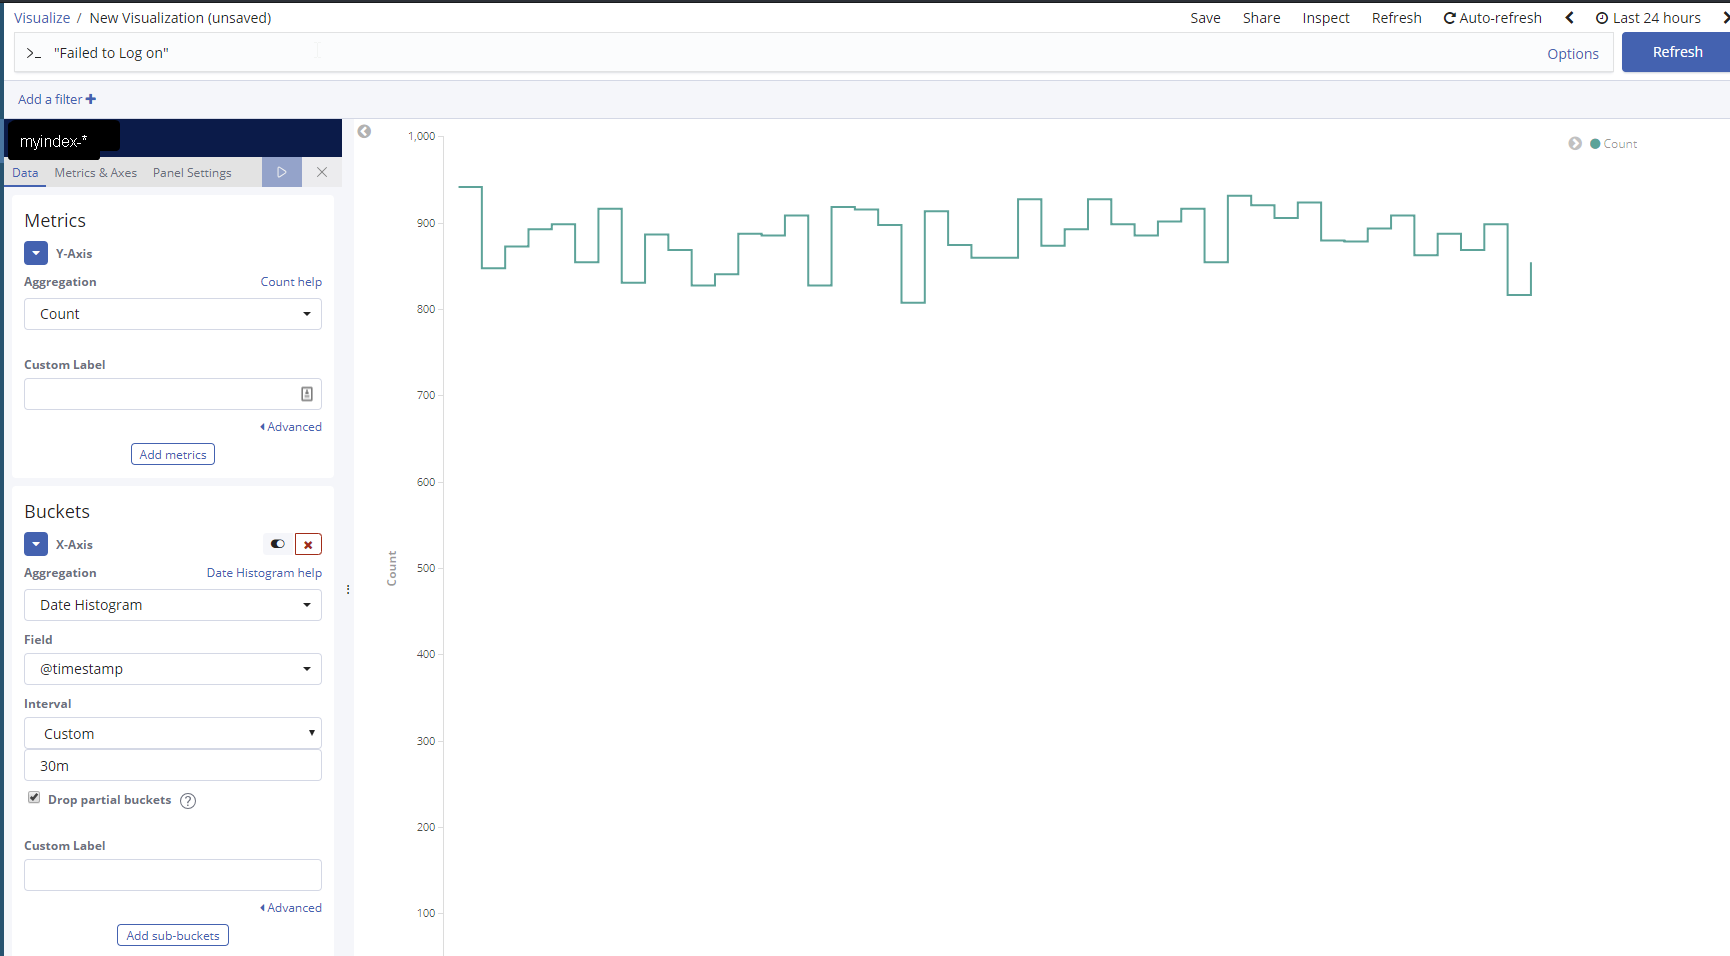
I was playing around with a very simple Timelion graph and am perplexed by some of the results. The interval window is set to 30m:
// .es(index=myindex-*, q="Failed to log on", timefield=@timestamp).lines()
When I make this same visualization in Kibana (using Area, Table, Visual Editor, or looking in Discover), I get different results from Timelion. The main thing being that Timelion has two large spikes which are not present in the Kibana ones.
Any ideas what could be causing this?
I found this thread here about a similar issue, but no solution was found.
Timelion Visualization - Query is a little different than above since I was playing around with syntax to see if it made a difference (it didn't)
This is certainly strange. I've got a couple things we can try:
First make sure the queries are as close to the same as possible. For instance, in the Discover view and Area view I see you're using the default_field for searching (because you don't specify a search field) where in the Timelion graph you are specifying the "message" field to filter on. Make sure these are the same in both to avoid any discrepancy by changing your search in Discover/Area to message:"Failed to log on". If you also have this specified in the filter bar for your Timelion graph, you can remove it from the .es() expression.
If you're still seeing issues, turn on Elasticsearch query logging in Kibana's config and take a look at the logs. To do this:
Add elasticsearch.logQueries: true to your kibana.yml file
Start Kibana with the --verbose=true CLI argument (or logging.verbose: true in kibana.yml)
Test the queries that get logged when running the Area Visualization vs. Timelion Visualization. Is there any large difference in the query? If you run the queries manually do you see the same problem?
If you get these queries out of the logs and post them here, I'm also happy to help diagnose what may be happening.
It looks like the issue did come down to syntax. In the instances that I did specify the message field in the Timelion query I had the quotation marks backwards. I had:
q="message:'An account failed to log on'"
Instead of:
q='message:"An account failed to log on"'
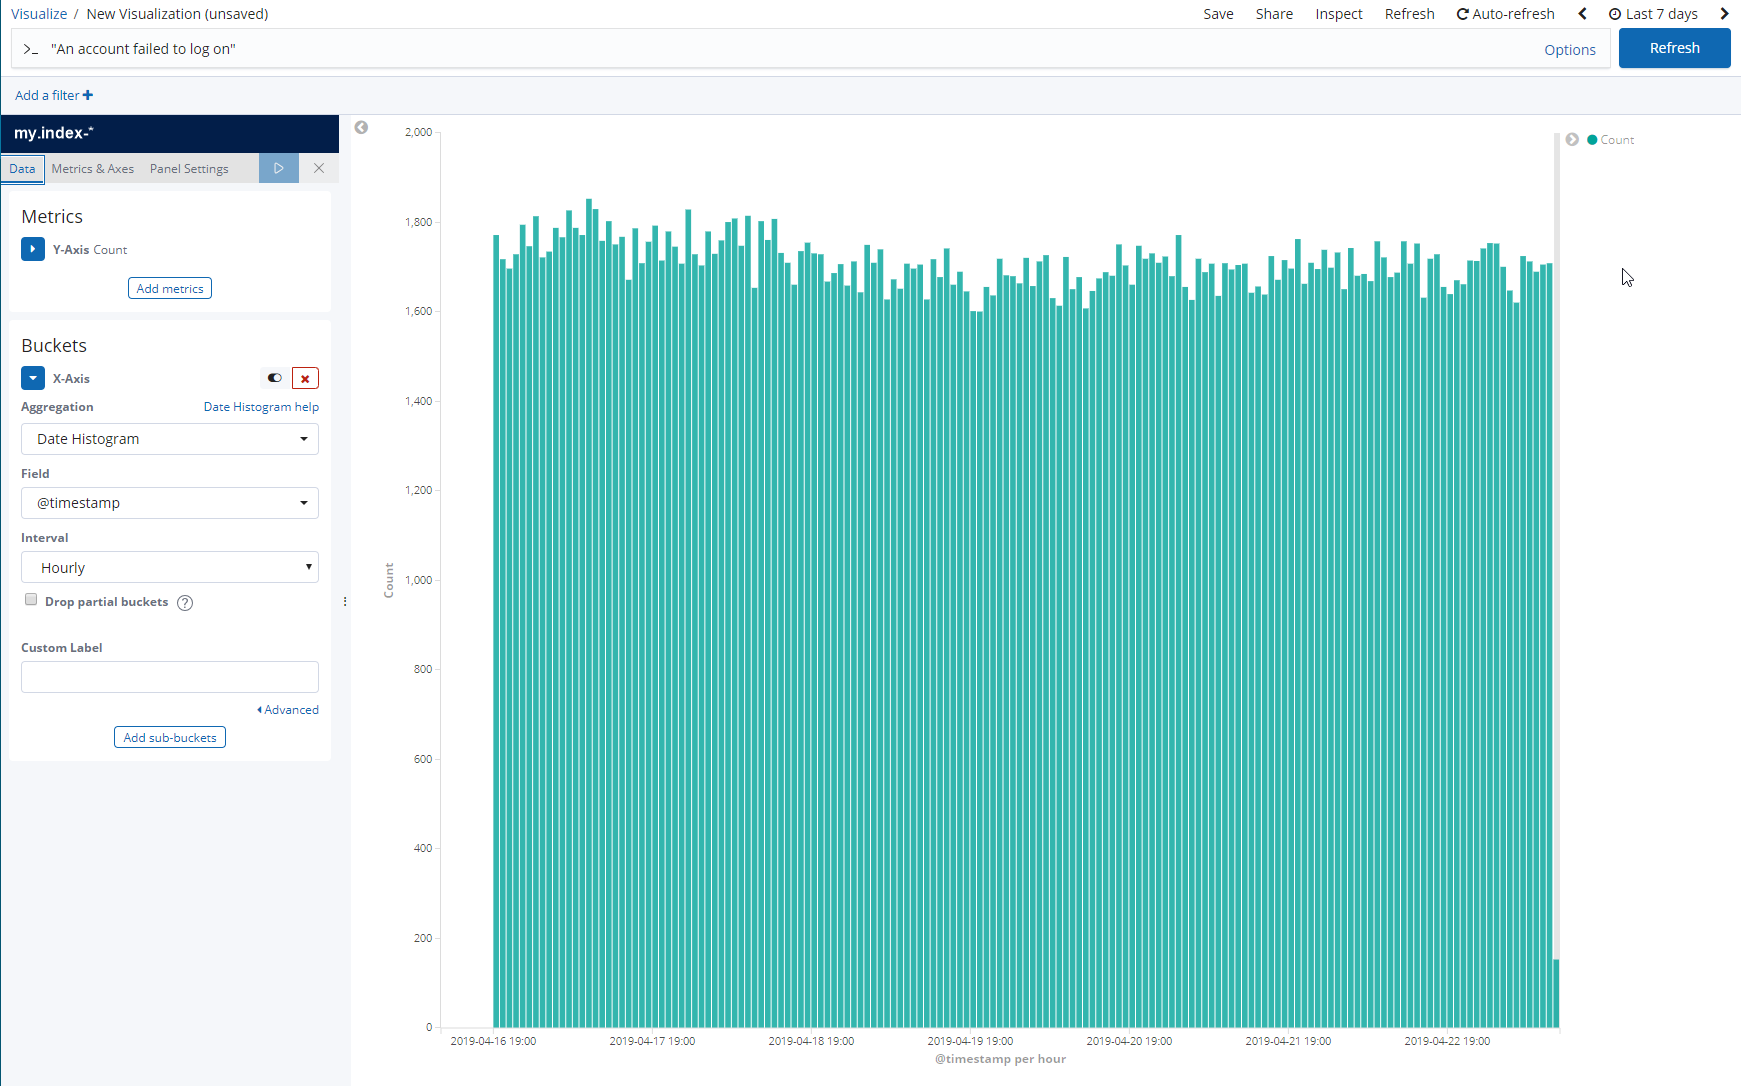
That said, it does look like Timelion processes queries with an unspecified search field differently than the typical area visualization.
In the two instances below, the queries are identical, but produce different results:
Apache, Apache Lucene, Apache Hadoop, Hadoop, HDFS and the yellow elephant
logo are trademarks of the
Apache Software Foundation
in the United States and/or other countries.