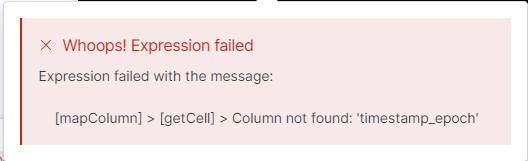
hi, the timestamp_epoch is not part of your requested table,
you can visualize the returning table from the timelion query replacing your expression with:
timelion
  query=".es(index=my-index-*,
				timefield='timestamp',
   				metric=cardinality:field1.keyword,
				q='field2.keyword:xxx AND field3.keyword:yyy AND NOT field4.keyword:NULL')
				.label('my-label')" timezone="Australia/Sydney" from="now-24h" interval="auto"

| table
| render
and you will find the columns returned by your timelion query
@markov00
Thanks for the tip.
I see only 3 columns are returned.
Is there a way I can use other/more fields from my-index?
Also, where is @timestamp coming from?
It is not in the doc. Is it an internal field that is mapped to the internal field 'Time'?
Last, but not least, in the table created, the @timestamp shows the correct time by timezone. Howcome it changes to UTC when using plot? Or maybe this is the root cause of the bug?! i.e the bug is in the plot function and not rendering the correct time.
If I'm not wrong, querying your data with timelion returns only series with timestamp and value (and an eventual label). the @timestamp column name is just a mapping name for your timefield . If you have more than one timelion series it probably returns more columns but I haven't tried.
If you need to return more aggregated columns and data it's better to move to ESQL that gives you much more flexibility then timelion.
The issue with the UTC dates is on the plot rendering function not on the data provided to that renderer.
Apache, Apache Lucene, Apache Hadoop, Hadoop, HDFS and the yellow elephant
logo are trademarks of the
Apache Software Foundation
in the United States and/or other countries.