Using packetbeat to analyse my server traffic. there is no issue on data insert.
I tried the below query to view the IP [ byes_in ] inbound usage metrics on Timelion. But getting different graph pattern. I compared it with normal network usage tools [ MRTG ].
I used packetbeat default settings [ period - 10s ]
.es(index=packetbeat-*,q=dest.ip:172.16.10.10,metric=avg:dest.stats.net_bytes_total).divide(10).multiply(8)
Any chance you could post what you're seeing and what you expect? It would be helpful for understanding what might be wrong.
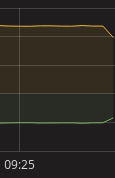
Timelion Graph:
Another tool graph:
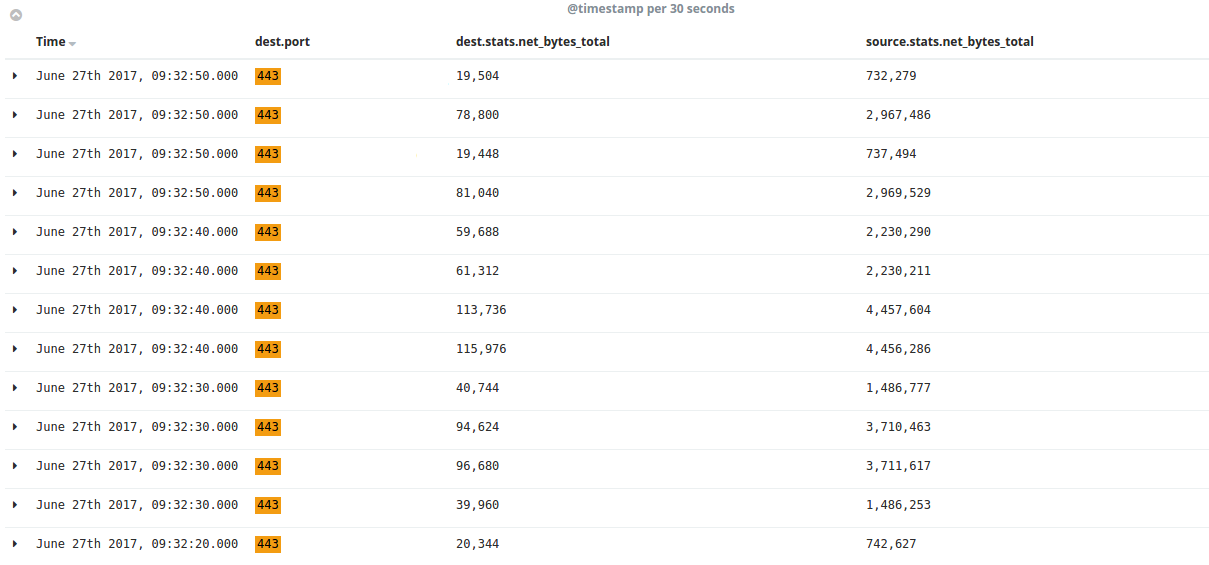
Sample data:
Timelion Query:
.es(index=packetsflow-,q=dest.ip:10.21.98.204,metric=avg:dest.stats.net_bytes_total).divide(10).multiply(8).title(Bandwidth).label(In).yaxis(units=bits/s),
.es(index=packetsflow-,q=dest.ip:10.21.98.204,metric=avg:source.stats.net_bytes_total).divide(10).multiply(8).title(Bandwidth).label(Out).yaxis(units=bits/s)
The time range on the two graphs here isn't the same, there's very little overlap, so it's hard to see if the data looks the same or not. The fluctuations you see in timelion aren't really visible in the other graph. This is the overlapping view:
Timelion
Other tool
But maybe you just mean the values are off (~700kbps vs ~6mbps). I believe the problem there is your math. Why are you dividing the value by 10 before you multiply it by 8? There are 8 bits in a byte, and since you're trying to convert bytes to bits, you need only multiply by 8.
So if we look at the output value at, say, 9:26, that value looks to be about 640kB/s. 640kB/s * 8 = 5120kbps. The graph on the other tool seems to be closer to 6000kbps. That's a sizable discrepancy, and I'm not sure why. Assuming that other tool is traffic from the same box/IP, I would indeed expect the numbers to be closer. Perhaps the time bucketing is different between the two, and that's why the average values are a bit different? I'm not sure I buy that though.
Is it possible to compare the values you see at a given time between the 2 tools? Not the average value, but the value at a single slice of time. That way you could see if the source records are off.
thanks for your reply.
And let me check and update you.
btw, reason for divide the value by 10 is, packetbeat sends the data for every 10s once. So If I need to get the seconds data, then I should divide the value by 10. so that I can get per second data. Am I right , please correct if its wrong.
No, that's not actually correct. Elasticsearch does that for you as part of the query. You are asking it "given whatever records you have, over a specific period of time (the time picker range), give me the average values bucketed up by some time interval (slices of that overall range)". It doesn't matter what your sampling rate is, or how many records are there, it'll give you that average. Of course, if the sampling rate is 10 seconds, and you ask for a value sliced up by less than that, it can sometimes give you some weird extrapolated results, but that's kind of a tangent here.
The bottom line is, you don't need to, and in fact should not, account for the sampling rate in of the data when you are doing a query. That's Elasticsearch's whole job.