Hi Team,
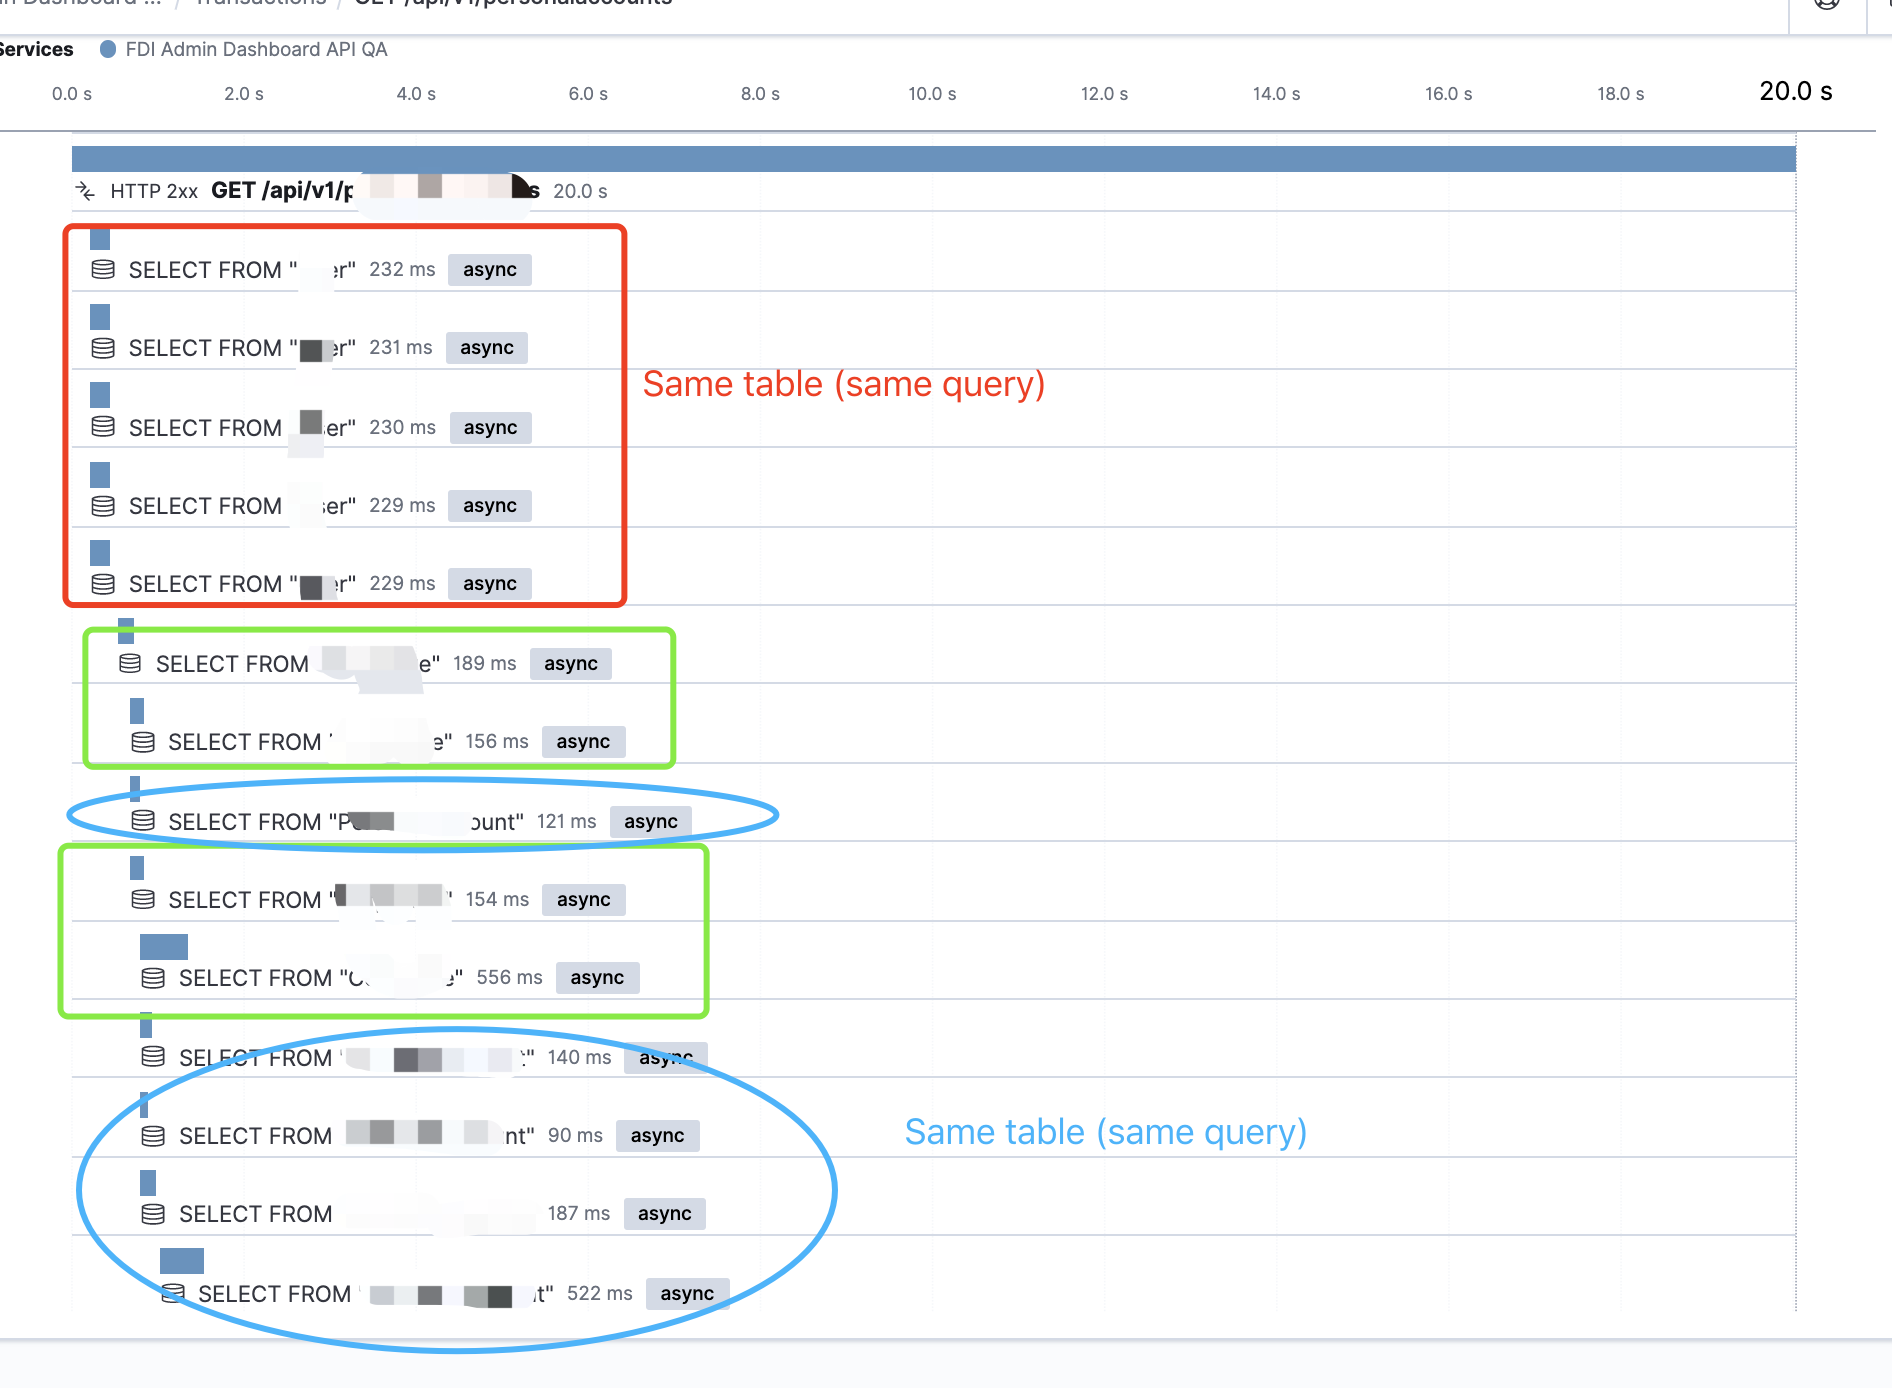
When we are doing a load test with JMeter (simulate multiple users doing the same operation at the same time) for our application (using the default APM rules, no customization yet), we found there are lots of duplicated DB queries showed in one transaction, can you advise if this can be a case: the transaction spans of different request (to the same API) are mixed together in one transaction?
Kibana version: latest
Elasticsearch version: latest
APM Server version: latest
APM Agent language and version: elastic-apm-node, v3.6.1
Is there anything special in your setup? no
Description of the problem including expected versus actual behavior. Please include screenshots (if relevant):
We are using Objection + knex to connect to Postgre DB, in our service, we are getting a table with its relations. But according to the transaction sample, the main table was called several times which was confused.
PS: when doing the same through our website (UI) to call the same API (once), the transaction trace is correct.