Hello dear sirs,
We are using .esJsonRDD() to copy an index from an Elasticsearch cluster to Spark cluster, and lately we started to observe that this copy is taking 10-14 hours instead of 2-3. Here's what is going on.
Cluster and index setup
We have an Elasticsearch 6.8 cluster on AWS EC2 with 3 machines, 2 cores/14 Gb RAM each (i3.large).
Elasticsearch is configured to use 7Gb of memory.
The index that we copy contains 54 million documents, which correspond to 8 shards ~20 Gb each.
Performance metrics
CPU of one of the nodes is through the roof:
So is the Load Average.
Also we notice that thread pool queue is at size 60 and stays like this:
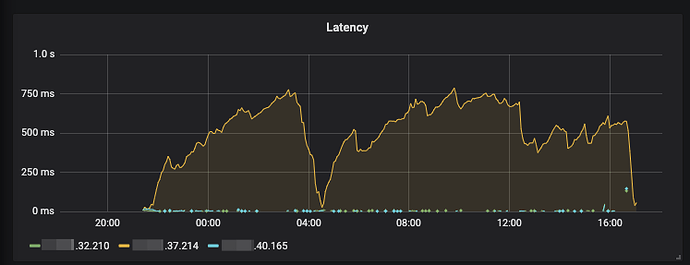
And search query latency is also very big on that instance:
Logs
We enabled logging of slow queries, and here's what we saw:
[2019-07-10T14:44:50,844][WARN ][index.search.slowlog.query] [AT1mr_C] [index-XXX][1] took[1.3s], took_millis[1327], total_hits[100044], types[person], stats[], search_type[QUERY_THEN_FETCH], total_shards[1], source[{"size":50,"query":{"match_all":{"boost":1.0}},"sort":[{"_doc":{"order":"asc"}}],"slice":{"field":"_id","id":63,"max":68}}], id[],
[2019-07-10T14:44:51,909][WARN ][index.search.slowlog.query] [AT1mr_C] [index-XXX][1] took[1.5s], took_millis[1570], total_hits[100006], types[person], stats[], search_type[QUERY_THEN_FETCH], total_shards[1], source[{"size":50,"query":{"match_all":{"boost":1.0}},"sort":[{"_doc":{"order":"asc"}}],"slice":{"field":"_id","id":32,"max":68}}], id[],
[2019-07-10T14:44:52,468][WARN ][index.search.slowlog.query] [AT1mr_C] [index-XXX][1] took[1.5s], took_millis[1539], total_hits[100337], types[person], stats[], search_type[QUERY_THEN_FETCH], total_shards[1], source[{"size":50,"query":{"match_all":{"boost":1.0}},"sort":[{"_doc":{"order":"asc"}}],"slice":{"field":"_id","id":59,"max":68}}], id[],
[2019-07-10T14:44:52,526][WARN ][index.search.slowlog.query] [AT1mr_C] [index-XXX][4] took[1s], took_millis[1034], total_hits[100538], types[person], stats[], search_type[QUERY_THEN_FETCH], total_shards[1], source[{"size":50,"query":{"match_all":{"boost":1.0}},"sort":[{"_doc":{"order":"asc"}}],"slice":{"field":"_id","id":11,"max":68}}], id[],
Basically, there are 68 parallel scrolls. Knowing that the thread pool size is 60 it is safe to say that most of the time those slices are waiting, not improving the speed of reading.
(I should say that we actually have 2 such indexes and do 2 esJsonRDD() in parallel.)
What I have seen from my own experiments with Elasticsearch performance under load, when thread pool becomes of non-zero size performance of that node degrades much faster, like in this case, leaving an impression that management of the thread pool consumes a lof of CPU and requires a lot of context switching (hence high load average).
An obvious fix would be to set the amount of parallel scroll requests (slices) so the throughput of a single node is enough.
I couldn't find any way to configure this slice number. The closest thing seems to be the es.input.max.docs.per.partition but I am not sure if it is going to work.
My question is:
How can we prevent Elasticsearch from getting clogged with too many parallel scroll slices, executed by esJsonRDD?
Or better, what would be the most effective way to dump contents of an Elasticsearch index to Spark?
Any advice or suggestion is welcome!
Thank you!
P.S. I was considering to file a bug in elasticsearch-hadoop since this slice-vs-thread pool size thing didn't seem right, but I was also not sure this description will be enough to narrow down the problem, so I decided to create a post here in hope that ES devs will see it and help me reason about the problem.
P.P.S. I have just checked, we use elasticsearch-hadoop=6.6.0 but I think little minor version difference should not impact. We use 8 spark slave machines.


