Hi @mikhatanu, this can be the normal behavior for OpenTelemetry JS instrumentations, yes. According to the OpenTelemetry spec for HTTP span namesby default the span name should just be the HTTP method (e.g. GET or PUT) unless it can be known that the span name will be low cardinality (i.e. won't have possibly 1000s of different values).
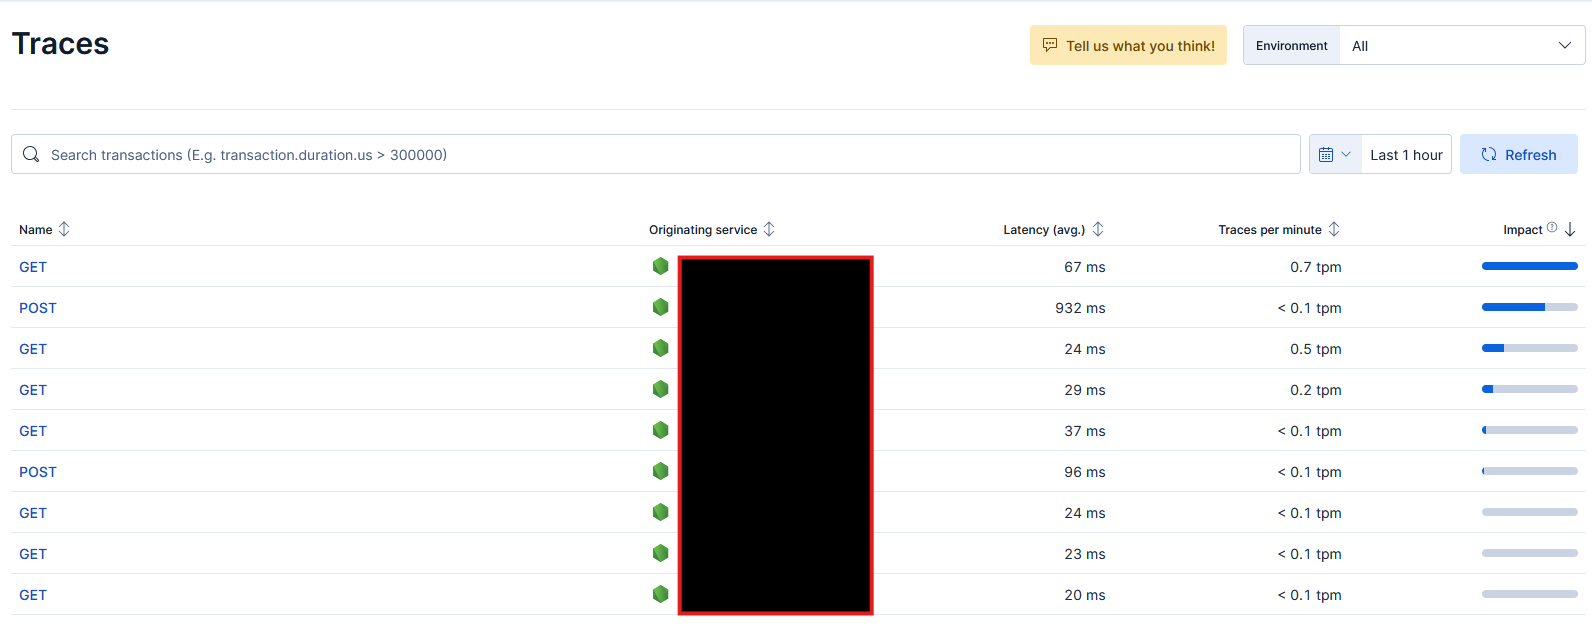
The url path is collected as part of the span. If you click on one of those "GET" spans in the trace view, a side panel will open. Search for "url.path" in the attributes.
The way one can get low cardinality information about the URL path is if the app uses a web framework and defines "routes". So, for example, if your application is using a framework like Express or Fastify, e.g.:
Then OpenTelemetry instrumentation for those frameworks will automatically get the route into the span name. The result would be that you see span names like GET /hi/:name or somelike that depending on the app's configured routes.
Apache, Apache Lucene, Apache Hadoop, Hadoop, HDFS and the yellow elephant
logo are trademarks of the
Apache Software Foundation
in the United States and/or other countries.