If you are asking about a problem you are experiencing, please use the following template, as it will help us help you. If you have a different problem, please delete all of this text 
Kibana version : 7.5.2
Elasticsearch version : 7.5.2
APM Server version : 7.6.0
APM Agent language and version : Java 1.12.0
Browser version:
Original install method (e.g. download page, yum, deb, from source, etc.) and version: kubernetes (elastic operator and elastic-apm helm chart)
We are outputing directly to elasticsearch
Is there anything special in your setup? We have a load balancer in front of all APM pods
Description of the problem including expected versus actual behavior. Please include screenshots (if relevant):
Two issues:
-
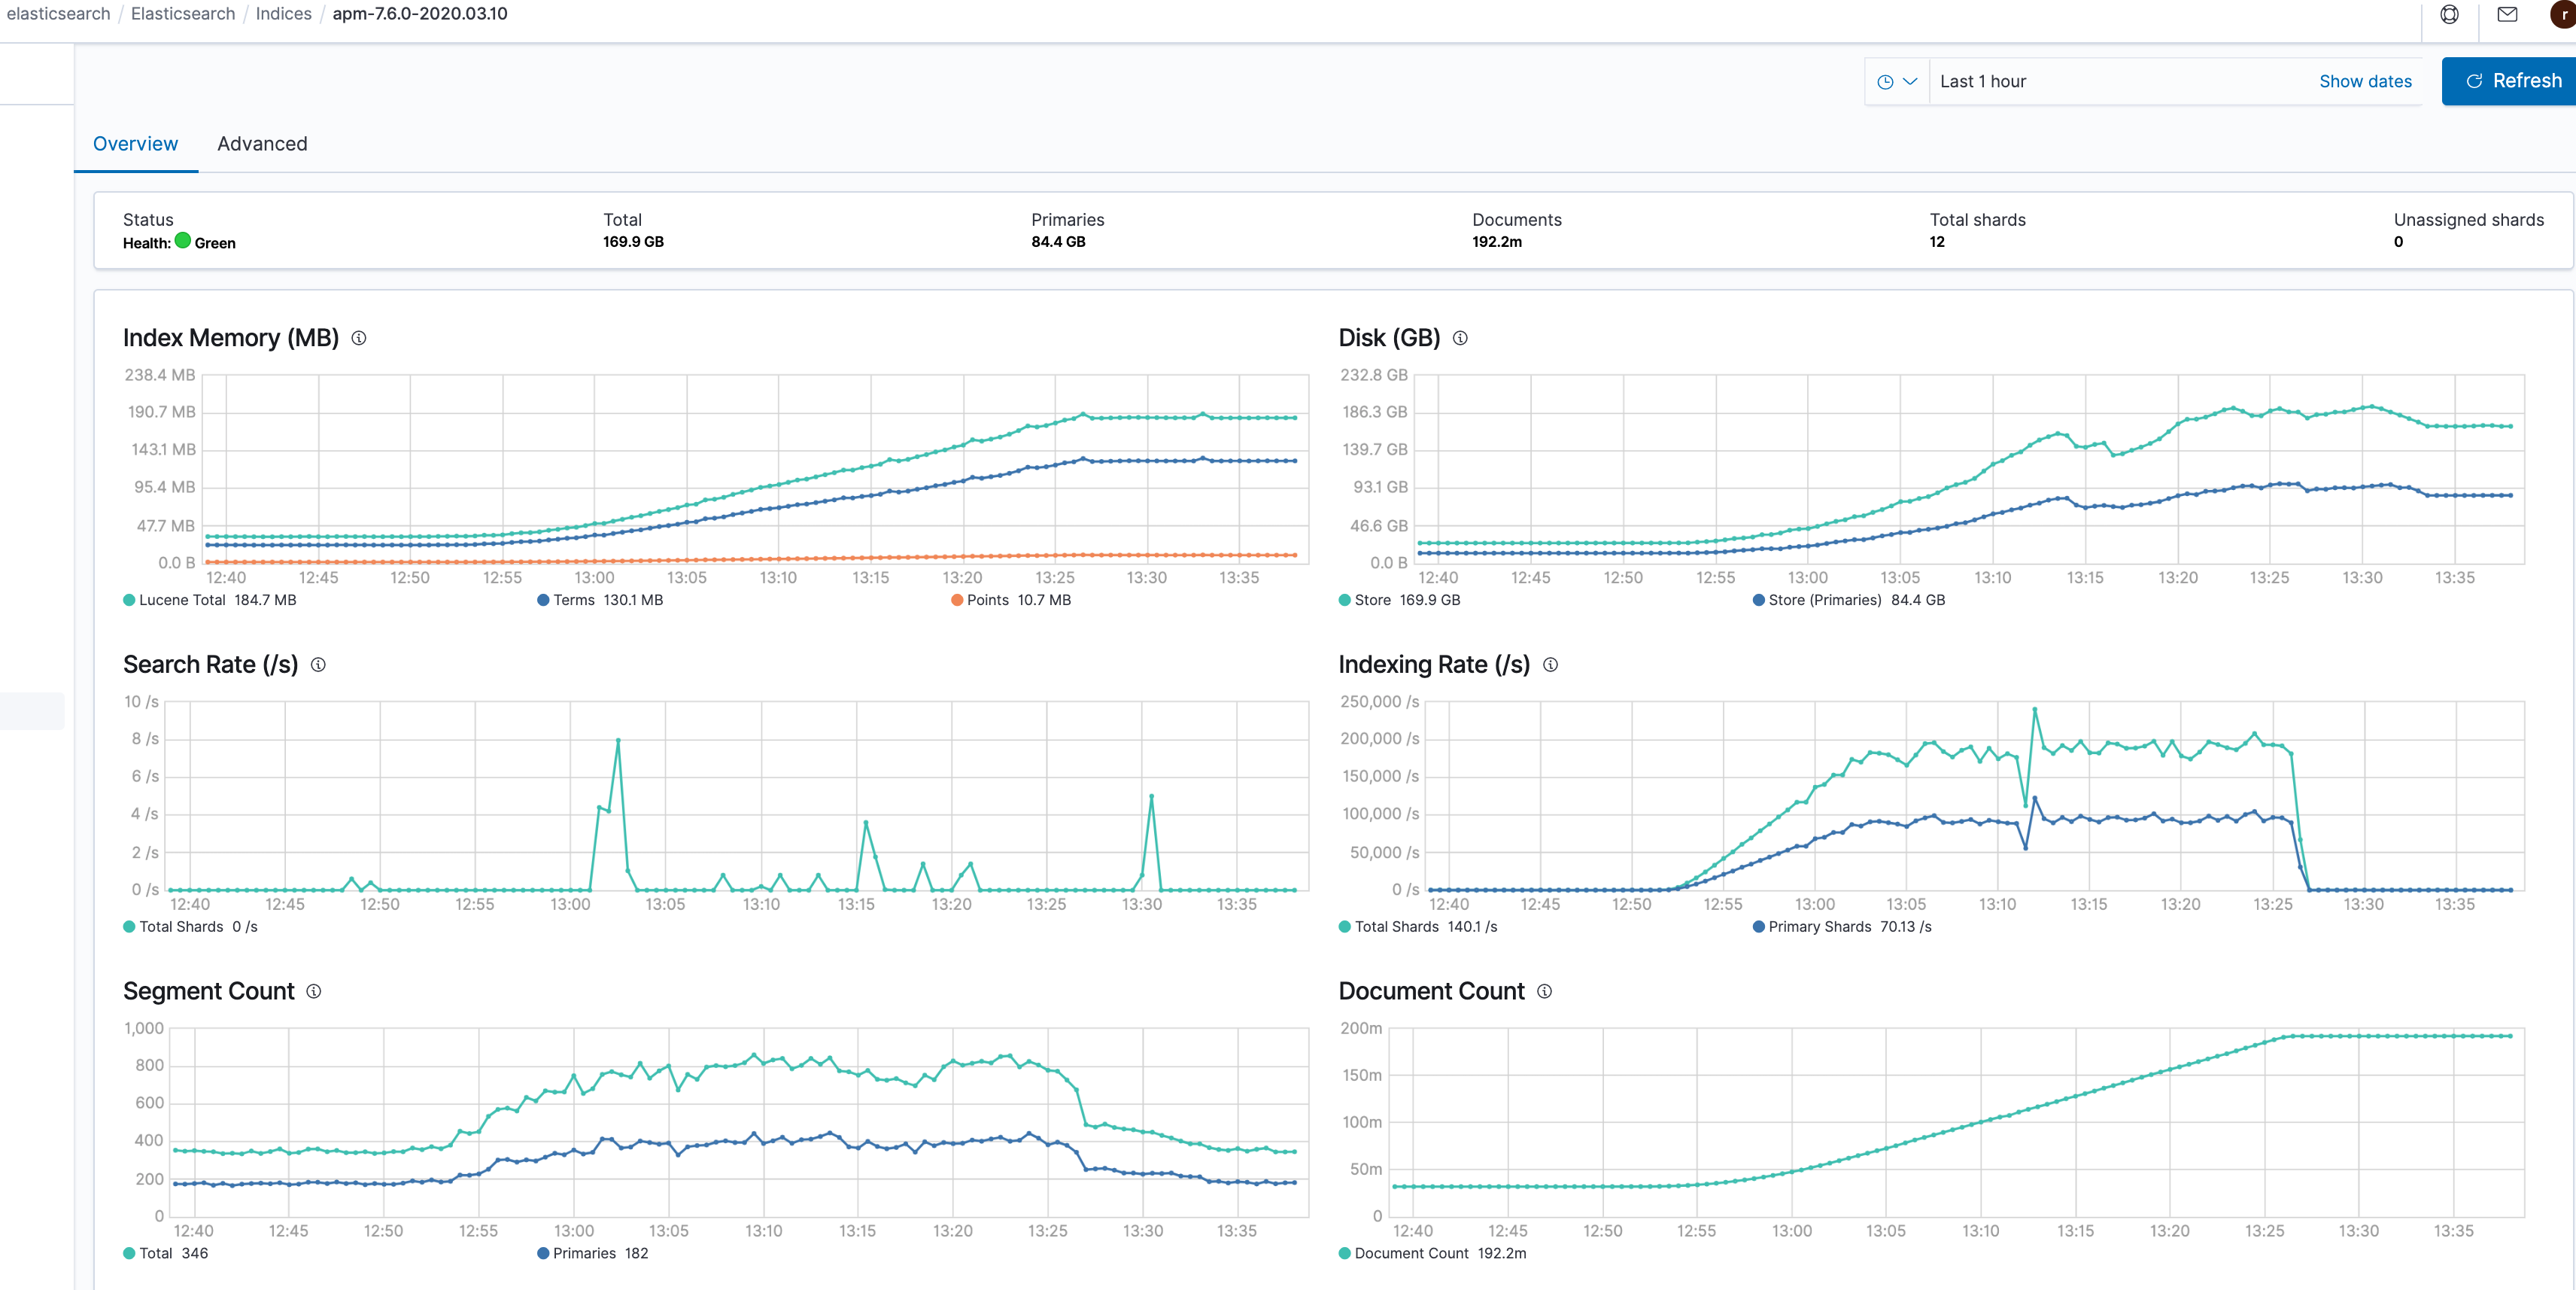
We changed the transaction_sample_rate from 1 to 0.05. This has no effect on the disk space, I do see that some transactions have no samples in the APM UI. APM metrics are taking too much of disk space, around 2.5GB every minute. This is not scalable for us. Let us know if we are doing anything wrong with the parameter "transaction_sample_rate"
-
We are also seeing HTTP body being captured when the default value https://www.elastic.co/guide/en/apm/agent/java/current/config-core.html#config-capture-body clearly says it should be OFF.

Metrics for APM and its index usage
Screen Shot 2020-03-10 at 1.38.45 PM|690x345

- thank you