Hi, I created a continuous Transforms to run once a day and calculate the P95 of some fields for the previous 24hrs. When I initially created and started this Transform it created the daily P95 values from all the previous indices the Transforms was pointing to. However, it has been two days now and I haven't seen any new data from this Transforms job and written to the index. When I go click 'preview messages' inside the Transforms config I do see 24hr old data there, but for some reason it is not writing it to the index so I'm not able to see it in the Discover window. Is there a way to check when the next Transforms is scheduled to run?
No, unfortunately there is no way to find out when it runs next, but you can find out when transform checked last. The _stats API returns a field called changes_last_detected_at. Given that you can extrapolate the next run. The format of the field is a timestamp, with ?human=true you can get readable format.
If there is a problem with the transform, stats should tell you.
The new data you are pushing in is not historic but "current"? Transform only checks data that is newer than the latest checkpoint according to the field you configured for sync.
When I change the frequency of the transforms to run every minute instead of once a day, I see the data stays updated. If I keep the frequency to run once a day then the data does not stay updated.
Yes, there is new data being written to the index every minute. I just feel running the transform every minute is probably putting unnecessary load on the cluster.
Can you share your configuration (or at least the essential parts)? Are you using a date_histogram as group_by?
There should not be any difference (after 24h) in the data whether you run it with a lower frequency or not. As you said, it just puts more load on the cluster. If you run it more frequent it will constantly update and write out intermediate results.
This is the transforms I configured to run once a day. It is currently calculating all the historical P95 calculations, however, when I check tomorrow around the same time I will not see an update for today's P95.
{
  "id": "transforms_p95_24hr",
  "source": {
    "index": [
      "transforms-ptx-v3"
    ],
    "query": {
      "match_all": {}
    }
  },
  "dest": {
    "index": "transforms_p95_24hr"
  },
  "sync": {
    "time": {
      "field": "@timestamp",
      "delay": "24h"
    }
  },
  "pivot": {
    "group_by": {
      "@timestamp": {
        "date_histogram": {
          "field": "@timestamp",
          "calendar_interval": "1d"
        }
      },
      "a_node": {
        "terms": {
          "field": "a_node"
        }
      },
      "bundle": {
        "terms": {
          "field": "bundle"
        }
      },
      "site": {
        "terms": {
          "field": "site"
        }
      },
      "z_node": {
        "terms": {
          "field": "z_node"
        }
      }
    },
    "aggregations": {
      "traffic.in": {
        "percentiles": {
          "field": "traffic.in",
          "percents": [
            95
          ]
        }
      },
      "traffic.out": {
        "percentiles": {
          "field": "traffic.out",
          "percents": [
            95
          ]
        }
      },
      "traffic.capacity": {
        "percentiles": {
          "field": "traffic.capacity",
          "percents": [
            95
          ]
        }
      }
    }
  }
This is the one I created yesterday which runs the transform every minute for the previous 24hrs and is showing me yesterday's P95 calculations:
{
  "id": "transforms_p95",
  "source": {
    "index": [
      "transforms-ptx-v3"
    ],
    "query": {
      "match_all": {}
    }
  },
  "dest": {
    "index": "transforms_p95"
  },
  "sync": {
    "time": {
      "field": "@timestamp",
      "delay": "60s"
    }
  },
  "pivot": {
    "group_by": {
      "@timestamp": {
        "date_histogram": {
          "field": "@timestamp",
          "calendar_interval": "1d"
        }
      },
      "a_node": {
        "terms": {
          "field": "a_node"
        }
      },
      "bundle": {
        "terms": {
          "field": "bundle"
        }
      },
      "site": {
        "terms": {
          "field": "site"
        }
      },
      "z_node": {
        "terms": {
          "field": "z_node"
        }
      }
    },
    "aggregations": {
      "traffic.in": {
        "percentiles": {
          "field": "traffic.in",
          "percents": [
            95
          ]
        }
      },
      "traffic.out": {
        "percentiles": {
          "field": "traffic.out",
          "percents": [
            95
          ]
        }
      },
      "traffic.capacity": {
        "percentiles": {
          "field": "traffic.capacity",
          "percents": [
            95
          ]
        }
      }
    }
}delay means your data could arrive up to 24 hours late (ingest delay), this means it can take up to 24 hours between the creation of the signal, ingest, data available in elasticsearch. This does not configure how often transform runs.
I think what you are looking for is frequency, frequency defines how often transform checks for new data. You must configure it as part of the body at the same level of sync, pivot, etc.
You do not need to re-create your transform, but you can use update. In recent versions we have UI support for update.
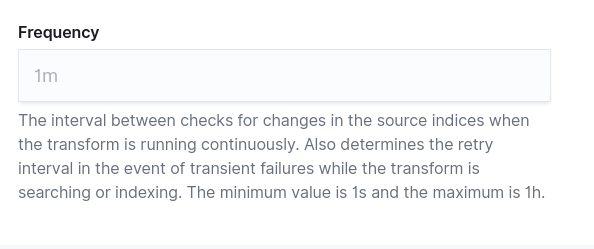
I believe the "delay": "24h" in the JSON output is generated by what gets entered when selecting the frequency from this WUI:

I believe the "delay" in this WUI means how often to run the transform, correct? Is there another frequency field that I should be configuring?
Since I want the daily P95 I set my Group By like this where @timestamp is "1d":

In the "Aggregation" section there is no drop down to select aggregate by 24hrs so I don't select @timestamp here, but instead, I select the IN and OUT traffic fields:

No, as I explained in the last post, delay is the ingest delay, it's the maximum time data can arrive late for various reasons. The explanation in the UI is correct.
However, it seems frequency misses a UI component in this wizard, I will let the UI team know.
You have 2 options: You can configure frequency by creating the transform in dev console (use "copy to clipboard", switch to dev tools, paste it there and edit it) or you use the edit function from the jobs list:

Choose edit, this should pop out:
As I don't know which version you are using, this might not be available, if so, dev console is the only option.
Thanks for the feedback, we will consider adding frequency to the UI wizard.
Update on the UI, in the upcoming version 7.10 frequency can be set on the wizard under "advanced settings", see https://github.com/elastic/kibana/pull/77370.
I'm using 7.8.1 and I do see the Frequency GUI when clicking on Edit on the Transform settings. When I checked for my 24hr Transform job the Frequency in that UI wasn't set to anything. I think I need to set the 24h time frame once while stepping through the UI when I enable "Continuous" mode, and then afterwards by clicking Edit and setting it there so that the Transform job checks for new data every 24hrs.
Exactly, the UI in 7.8 does not support frequency as part of the transform creation wizard, this is unfortunate, but will be fixed with 7.10.
Don't forget to set delay to a proper value.

Yes, that's correct, the current maximum is 1h. Better scheduling is planned for the future. The default is 1m.
Ok so I'll set it to one hour for now, better than running the Transform job every minute. 
Now i see the "frequency" field in the JSON right above "sync":
"frequency": "1h",
  "sync": {
    "time": {
      "field": "@timestamp",
      "delay": "24h"
}Wait, so then when the frequency was set to its default 1m for my 24h Transform job and my delay was set to 24hrs how come I don't see data past Sept 21? I'm guessing the delay is waiting for another 24hrs to pass before allowing Transform to run again?
delay offsets the ingest delay, please have a look at the explanation in previous posts.
An example to make this more clear. With a delay of 24h, transform assumes that it can not query for data that is younger than 24h, because there might still be data coming in.
Assume transform triggers at time A, it queries for data lower than A - 24h. That means your transform is always a day behind.
How is data ingested in your case? Where are the timestamp coming from? The default delay is 60s, this works for most use cases and has enough wiggle room. Remember, the default refresh interval of an index in elasticsearch is 1s, this is the minimum delay you should set.
Source data is being emitted from a network device every minute and sent to a Kafka cluster. Sparc is grabbing the data from Kafka and does some calculations/manipulations on the fly before it sends that data to a specific index inside ES (IndexA). This Sparc data is being ingested every minute. Then we have a transform job that does some aggregation on the Sparc data and stores the results in a different index (IndexB).
The transform job that I'm trying to write is using data from IndexB and trying to generate daily P95 values, and then stored into a new index (IndexC). There is a template that is applied to the source data coming in and any indices generated by the transform jobs. This is how the timestamp is being mapped in the template:
"@timestamp": {
        "type": "date"
},If I PUT the transform job from the dev console with the proper frequency of 24h, do you know if it will work with my current version of code?
ok, so delay should be the worst-case runtime for kafka, sparc, and indexing. You said that sparc runs every minute, so the default delay won't work, your delay is more than 1 minute. I do not know what kafka and sparc takes to queue and aggregate. On the other side you transform with a daily pattern, there seems no need to optimize delay, something like 5m seems sufficient to me.
Regarding frequency, the limitation to 1h is not a UI limitation, that means even dev console will not allow a higher value than 1h.