I have 2 data source
first one's data is for from: now-1w / to: now
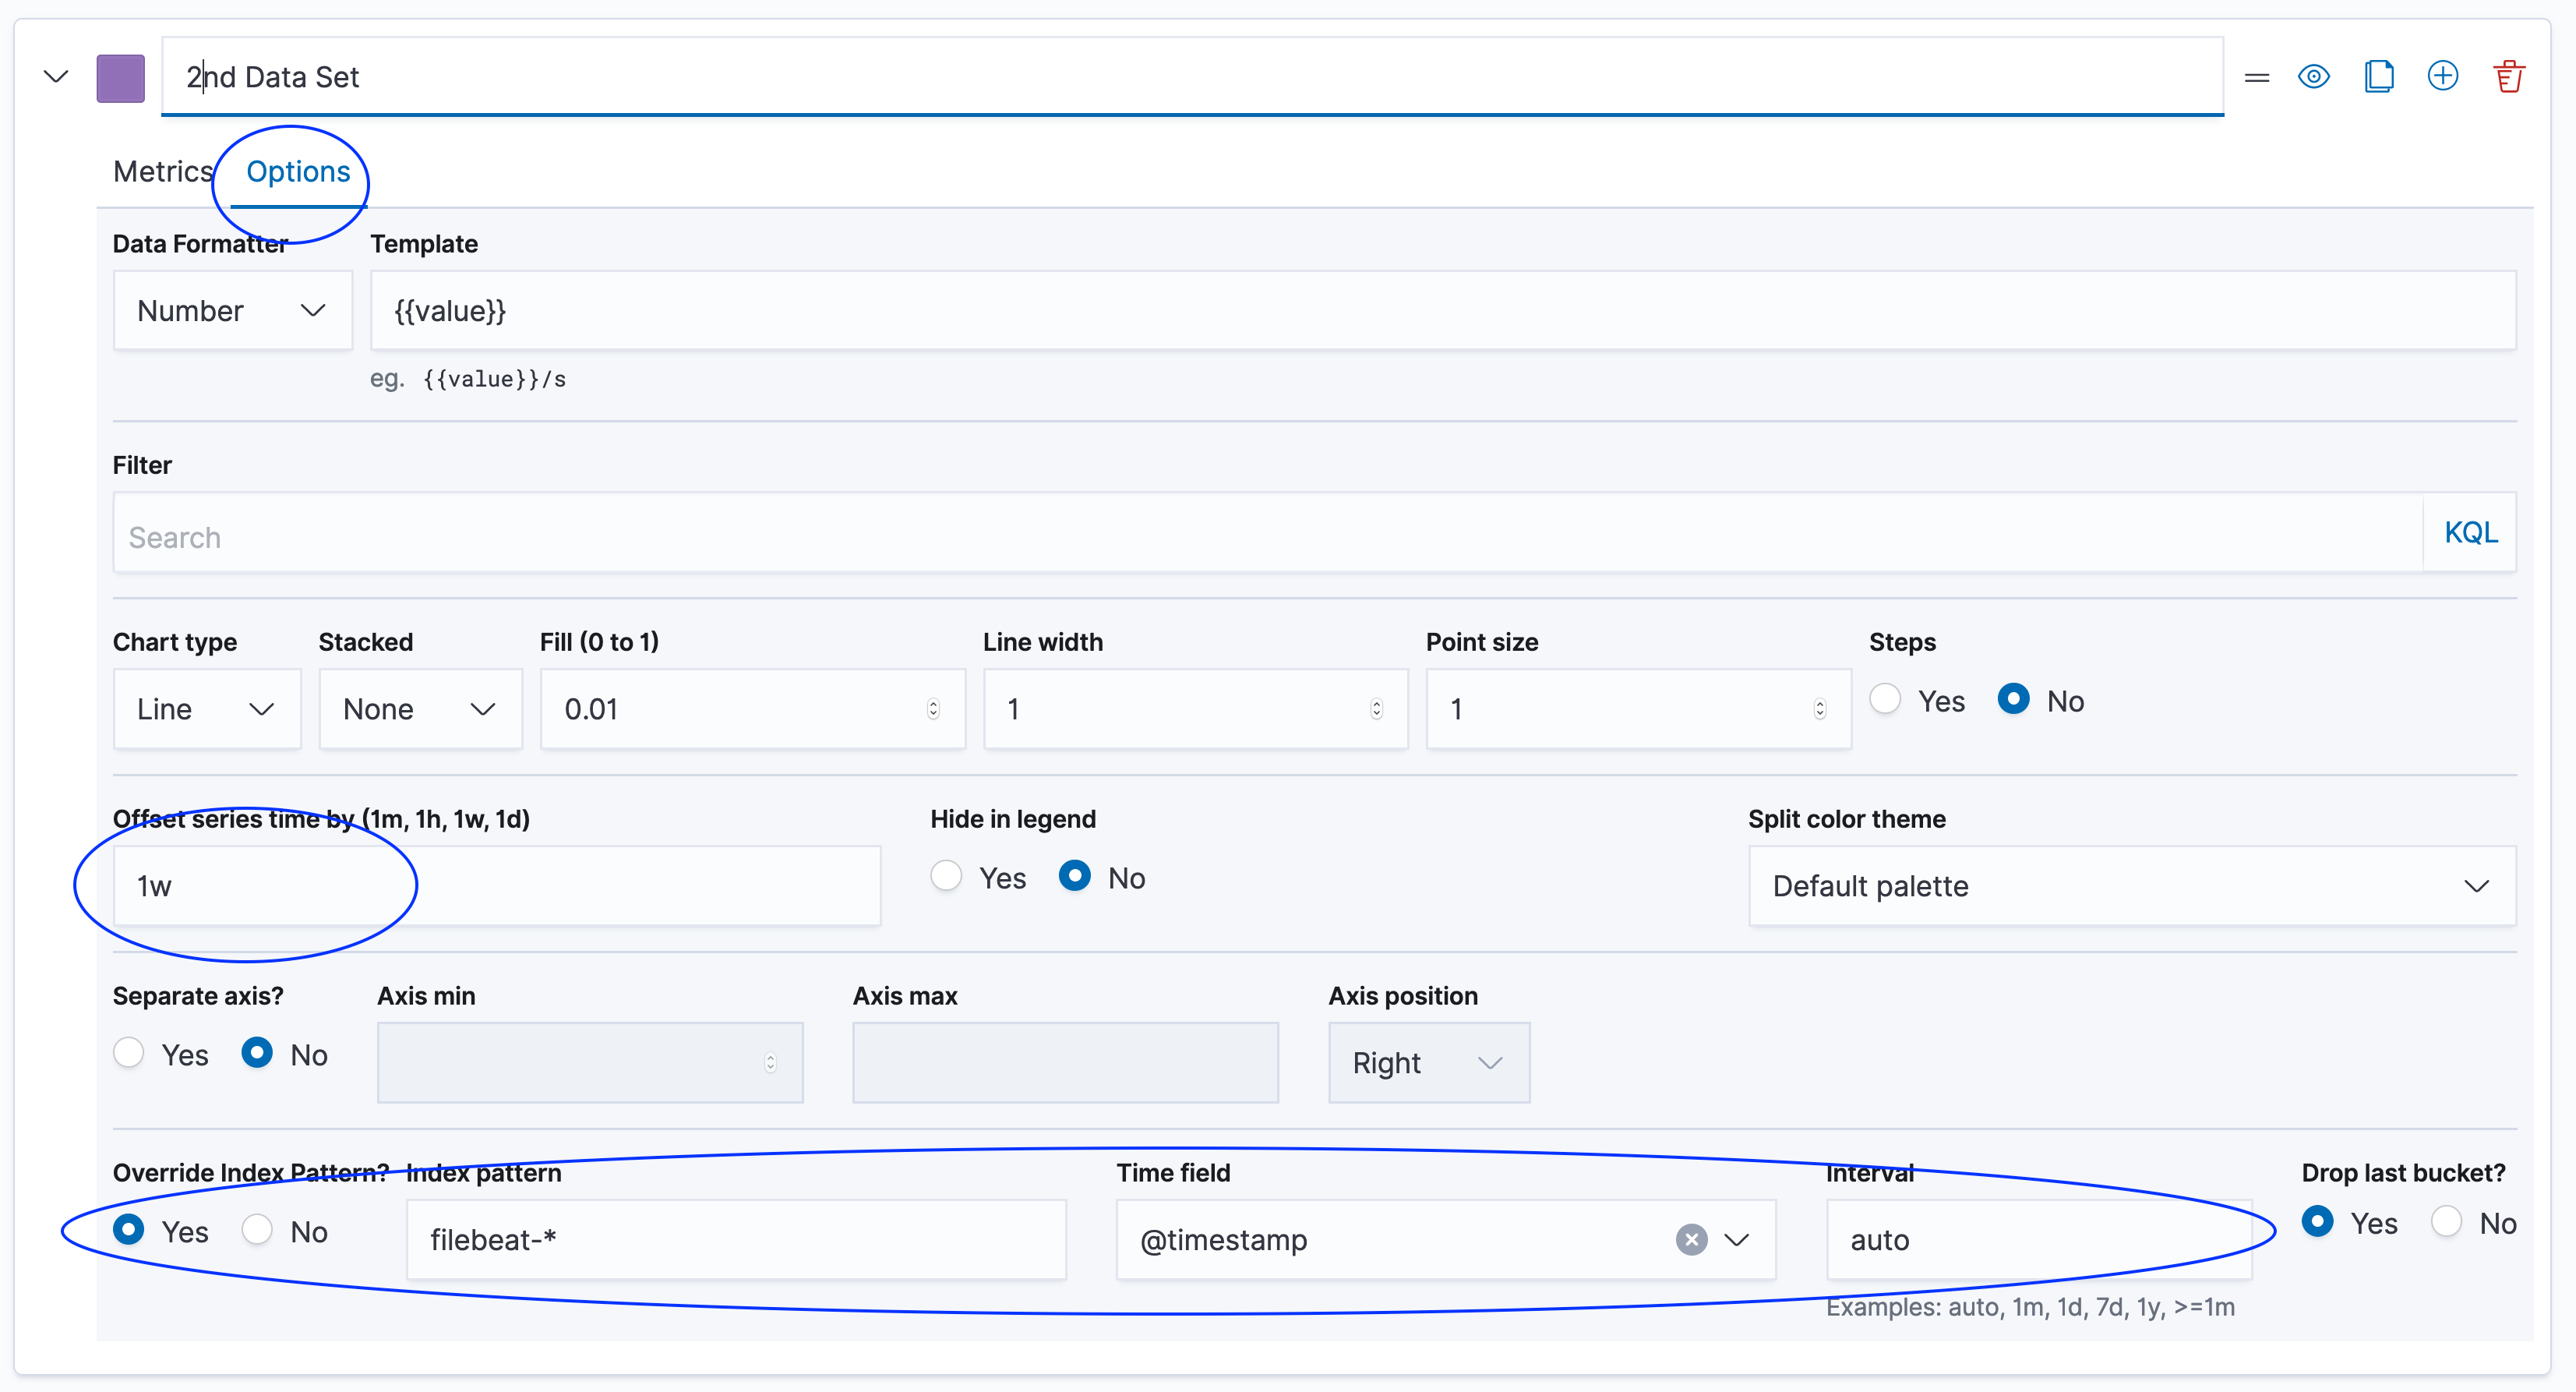
second one is from: now-2w / to: now-1
I want to visualize both of them in one line chart.
y axis is ratio and it's clear.
but how can i define x axis to load both of series in 1 chart? how can set x axis to Date-Time?
my challenge is how to define X axis to draw this 2 line on each other to compare differences. because our times are not same.