Hello All,
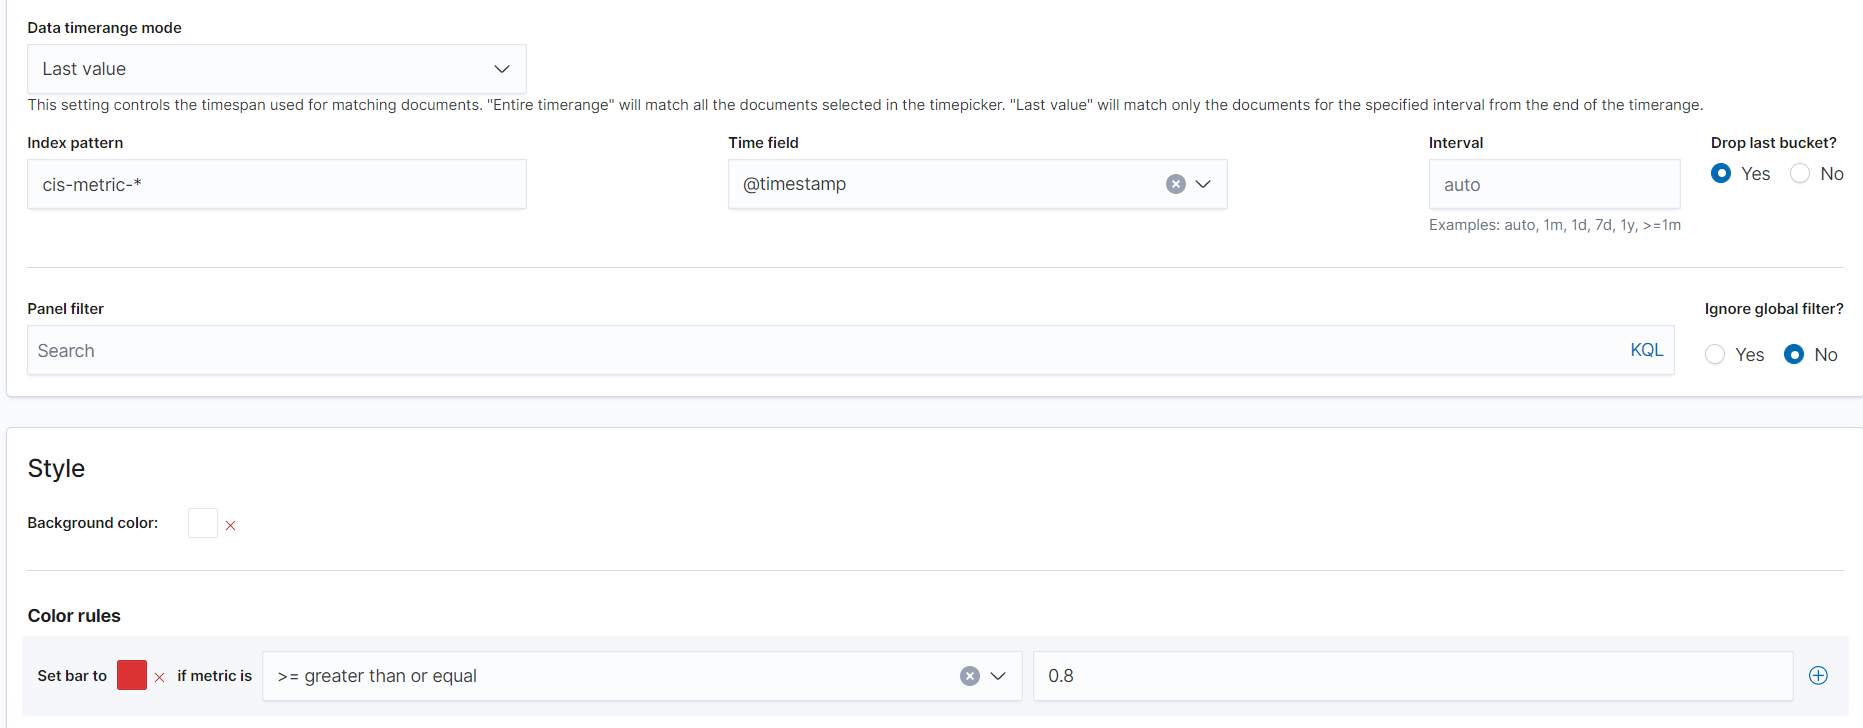
I've written a javascript script processor in which I'm trying to get only those mount points which have reached thrshold greater than some value,ex:greater than 90 %[kibana->panel filter-> field > 0.9],The challenge I'm facing is that I'm unable to get host.name event value in index from custom script written.
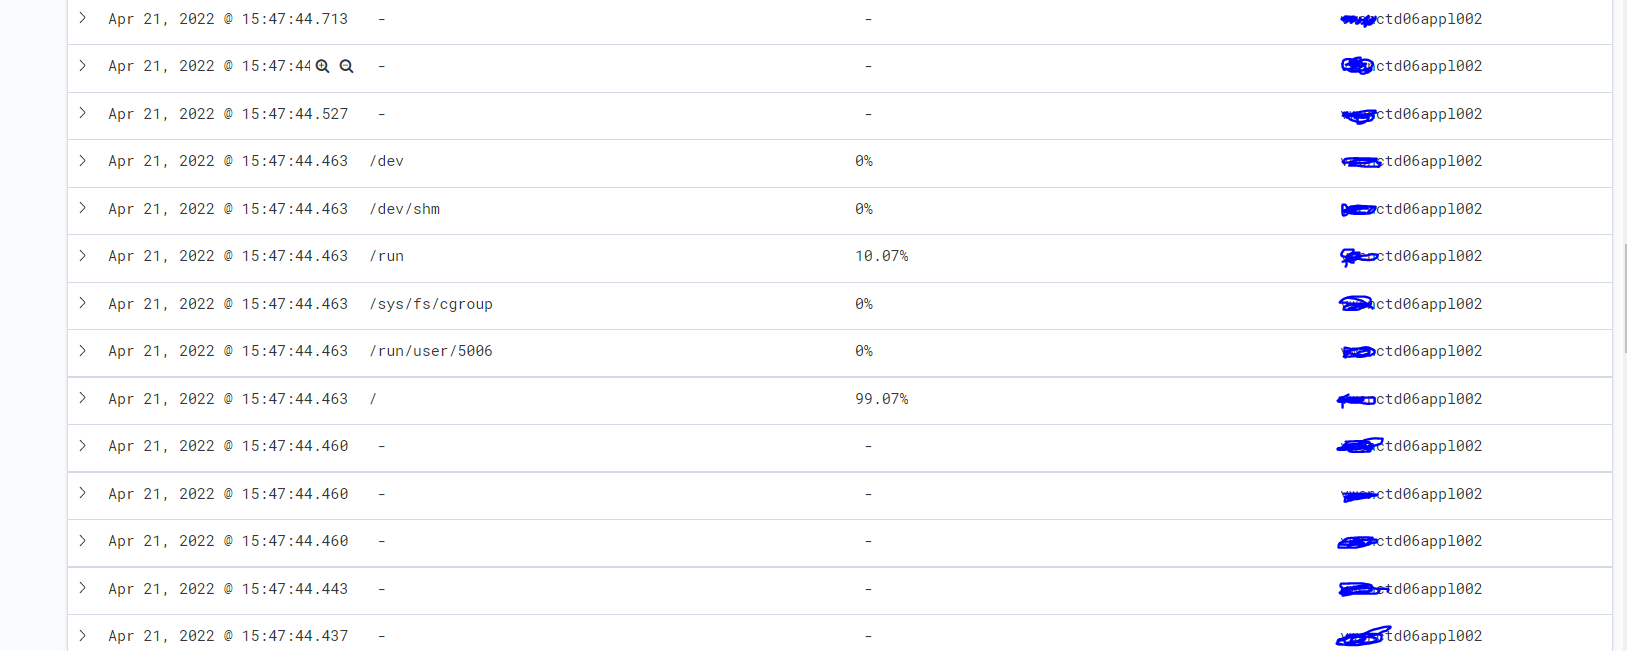
The filed I need is fieldname:mountpoint hostname,here "host.name" value shows as "null" .
var console = require('console');
function process(event) {
     var fileSystemUsedPercent = event.Get("system.filesystem.used.pct");//filesystem used percentage
     console.info("File system used percentage value [%s]", fileSystemUsedPercent);
     var mountPoint = event.Get("system.filesystem.mount_point");  //mountpoint name
     console.info("mountPoint [%s]", mountPoint);
	   var hostName = event.Get("host.name");       //hostname
     console.info("hostName [%s]", hostName);
     if(fileSystemUsedPercent > 0.8) {
		     event.Put("filesystem.status","critical");
         event.Put("filesystem.mount.host",mountPoint + ' ' + hostName);//display hostname and mountpoint if greater than treshold
         console.info("filesystem.status [%s]", event.Get("filesystem.status"));
     }


     return event;
 }
2022-04-04T11:11:54.237+0200	INFO	[processor.javascript]	console/console.go:50	File system used percentage value [0.1029]
2022-04-04T11:11:54.238+0200	INFO	[processor.javascript]	console/console.go:50	mountPoint [/run]
2022-04-04T11:11:54.238+0200	INFO	[processor.javascript]	console/console.go:50	**hostName [null]**
2022-04-04T11:11:54.238+0200	INFO	[processor.javascript]	console/console.go:50	filesystem.status [critical]
metricbeat.yml
metricbeat.config.modules:
  path: ${path.config}/modules.d/*.yml
  reload.enabled: false
setup.ilm.enabled: true
setup.ilm.check_exists: true
setup.ilm.rollover_alias: mis-metric
setup.ilm.pattern: '{now/d}-000001'
setup.ilm.overwrite: false
setup.kibana:
  host: http://td06appl002.dev.dm01.group.v:5601
output.elasticsearch:
  hosts:
  - http://td06appl002.dev.dm01.group.v:9200
processors:
- add_fields:
    fields:
        configfile: ${DM_SHARED}/MIS/globalconfiguration.properties
- rename:
    fields:
    - from: agent.hostname
      to: host.name
    ignore_missing: true
    fail_on_error: false
- drop_fields:
    fields:
    - host.mac
 #  - system.process.cmdline
    - ecs
    - agent.ephemeral_id
    - agent.type
    - agent.version
    - agent.hostname
    - event
monitoring.enabled: true
monitoring.elasticsearch: null
#logging.level: debug

type or paste code here
what could be reason I'm unbale to get hostname,"filesystem.mount.host",mountPoint + ' ' + hostNam(JS script)
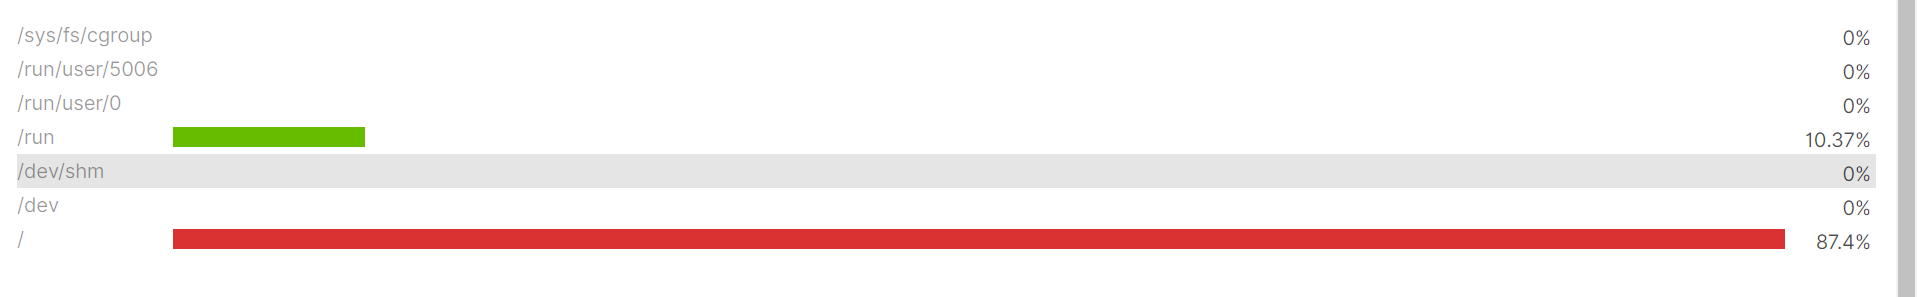
Note:I just want to show critical mountpoint usage with there hostname and percentage consumed,here even in panel filter system.filesystem.used.pct > 0.8 dosent't work according to needs,end result is display only critical with red bar .
Thanks