It is working fine(able to visualize ) without using date filter . But it is considering DOB field as string. But I want DOB as date. Please help me ..
Kibi is a fork of Kibana so its possible its creators have changed some functionality from Kibana. Still, what you are describing looks like vanilla Kibana functionality so lets see if we can figure it out here.
It is working fine(able to visualize ) without using date filter
Referring to the last screenshot, you are actually asking Kibana/Elastisearch to aggregate (group by) the DOB field, not filter by it.
Are you saying that if you aggregate by another field, results are being shown on the right?
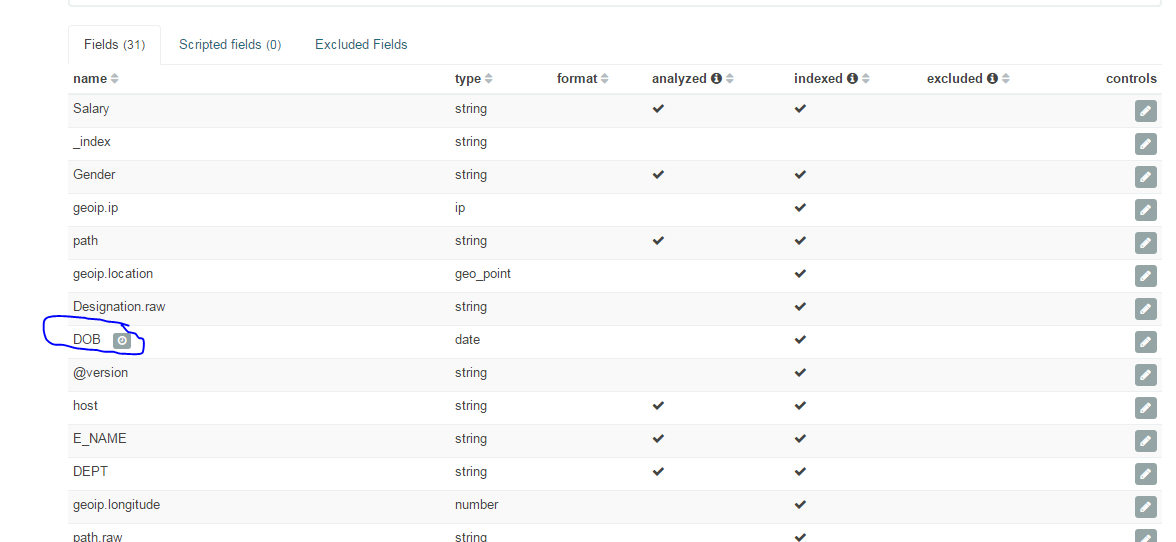
But it is considering DOB field as string. But I want DOB as date.
Hmmm... that is odd, especially since in the 2nd screenshot DOB is shown as a date. Referring to the 3rd screenshot, could you expand the Field drop down and paste a screenshot of that here, showing the DOB field in the list?
Apache, Apache Lucene, Apache Hadoop, Hadoop, HDFS and the yellow elephant
logo are trademarks of the
Apache Software Foundation
in the United States and/or other countries.