Use Metricbeat to monitor LXC containers

I'd like to use metricbeat to collect cpu and memory usage so that I can better monitor running applications and be alerted when an application is crashing in a loop. I used this code to start metricbeat in docker in the lxc container but it doesnt seem to report cpu usage and memory usage correctly.

docker run -d --name=metricbeat --user=root --volume="$(pwd)/metricbeat.docker.yml:/usr/share/metricbeat/metricbeat.yml:ro" --volume="/var/run/docker.sock:/var/run/docker.sock:ro" --volume="/sys/fs/cgroup:/hostfs/sys/fs/cgroup:ro" --volume="/proc:/hostfs/proc:ro" --volume="/:/hostfs:ro" docker.elastic.co/beats/metricbeat:8.3.3 metricbeat -e -E output.elasticsearch.hosts=["192.168.2.132:9200"]

Does somebody know a solution to that problem?

Hi @SamTV12345,

Just to clarify, are you running Metricbeat inside a docker container that is running inside a LXC?

What is incorrectly reported? Are the values completely off or are they regarding the host of the LXC container rather than the LXC container itself?

Also, what metrics are you interested in? The docker containers or the LXC container?

Hi @TiagoQueiroz ,

thanks for the quick answer. Yes that is my use case. You have a lot less overhead than running a complete Ubuntu VM. In Proxmox you have a summary for every LXC with CPU usage and used/free/total memory. Sometimes an application crashes when auto updating with containerr watchtowerr and uses a lot of CPU. I’d like to get notified when this happens. In addition I’d like to create dashboards for all LXC containers.

To test I started stress testing an LXC (CPU usage should be 1) but with the host cpu usage field I could only get the underlying host cpu usage of 26% (1 of 4 cores is mapped to the LXC)

Thanks for helping me.

I do the same on my homelab, Proxmox and a bunch of LXC, the only VM running is Home Assistant.

Could you share your metricbeat.yml (remember to redact any sensitive information)?

Just to double check I understood what you want to do: you want to run Metricbeat inside a docker container and Metricbeat should get the metrics from the host (the LXC container). Is that it?

Awesome @TiagoQueiroz . So we have the same use case. To demonstrate I stress test the lxc container, not the host:

image

and in kibana host.cpu.usage says 0.80 and container.cpu.usage 0.002. But I want to get the lxc usage of 1 or 100%.

This is my metricbeat.yml which is mapped into the container with the above command:

metricbeat.config:
  modules:
    path: ${path.config}/modules.d/*.yml
    # Reload module configs as they change:
    reload.enabled: false

metricbeat.autodiscover:
  providers:
    - type: docker
      hints.enabled: true

metricbeat.modules:
- module: docker
  metricsets:
    - "container"
    - "cpu"
    - "diskio"
    - "healthcheck"
    - "info"
    #- "image"
    - "memory"
    - "network"
  hosts: ["unix:///var/run/docker.sock"]
  period: 10s
  enabled: true

processors:
  - add_cloud_metadata: ~

output.elasticsearch:
  hosts: '${ELASTICSEARCH_HOSTS:192.168.2.132:9200}'
  username: '${ELASTICSEARCH_USERNAME:elastic}'
  password: '${ELASTICSEARCH_PASSWORD:changeme}'
  index: "metricbeat-%{[agent.name]}"


setup.template:
    name: 'metricbeat'
    pattern: 'metricbeat-*'
    enabled: false

How did you run your stress test? Did you run it directly on the LXC container or as a docker container?

Your Metricbeat is configured to collect metrics from docker containers, so if your containers are idle and you're stressing the host, you won't see this in the metrics.

I went the lazy way to try this out and deployed the Elastic-Agent (it uses Metricbeat to collect the data) to my LXC container configured to get host metrics and what it got is pretty similar to what I see in Proxmox. Based on my charts it seems Proxmox is showing the "user" bit from what Metricbeat collected.

To collect the host metrics, you need to enable the system module.

In case you're curious, here are the metrics are reported by Proxmox and Metricbeat:


That looks just the way I want it to have @TiagoQueiroz . That explains why I didn’t get LXC usage when I’m only listening for docker. Could you please post your configuration and steps of installing the apm agent on the LXC container? Do I have to configure anything on the elastic server?

I meant the Elastic-Agent, not the APM Agents. On Kibana you go to Management -> Fleet -> Add agent. Then the UI guides you through the process.

Simply put (that's a huge over-simplification), the Elastic-Agent is a supervisor that deploys Beats for you. Everything is managed through Kibana, so no need to deal with YAMLs and low level details you mostly don't need to worry about.

Here is my config. Bear in mid it's auto-generated, so the keys are in no specific order, and there are loads of extra stuff/transformations. In the end of the day, all entries are the system module with specific configuration for each metricset.

metricbeat:
  modules:
  - cpu.metrics:
    - percentages
    - normalized_percentages
    id: system/metrics-system.cpu-4139c70a-4563-44b6-8aeb-929382380f31
    index: metrics-system.cpu-lxc
    meta:
      package:
        name: system
        version: 1.16.2
    metricsets:
    - cpu
    module: system
    name: system-2
    period: 10s
    processors:
    - add_fields:
        fields:
          dataset: system.cpu
          namespace: lxc
          type: metrics
        target: data_stream
    - add_fields:
        fields:
          dataset: system.cpu
        target: event
    - add_fields:
        fields:
          id: 79bd9b96-503a-4d0f-9e90-58adc53c4390
          snapshot: false
          version: 8.2.0
        target: elastic_agent
    - add_fields:
        fields:
          id: 79bd9b96-503a-4d0f-9e90-58adc53c4390
        target: agent
    revision: 1
  - diskio.include_devices: null
    id: system/metrics-system.diskio-4139c70a-4563-44b6-8aeb-929382380f31
    index: metrics-system.diskio-lxc
    meta:
      package:
        name: system
        version: 1.16.2
    metricsets:
    - diskio
    module: system
    name: system-2
    period: 10s
    processors:
    - add_fields:
        fields:
          dataset: system.diskio
          namespace: lxc
          type: metrics
        target: data_stream
    - add_fields:
        fields:
          dataset: system.diskio
        target: event
    - add_fields:
        fields:
          id: 79bd9b96-503a-4d0f-9e90-58adc53c4390
          snapshot: false
          version: 8.2.0
        target: elastic_agent
    - add_fields:
        fields:
          id: 79bd9b96-503a-4d0f-9e90-58adc53c4390
        target: agent
    revision: 1
  - id: system/metrics-system.filesystem-4139c70a-4563-44b6-8aeb-929382380f31
    index: metrics-system.filesystem-lxc
    meta:
      package:
        name: system
        version: 1.16.2
    metricsets:
    - filesystem
    module: system
    name: system-2
    period: 1m
    processors:
    - drop_event:
        when:
          regexp:
            system.filesystem.mount_point: ^/(sys|cgroup|proc|dev|etc|host|lib|snap)($|/)
    - add_fields:
        fields:
          dataset: system.filesystem
          namespace: lxc
          type: metrics
        target: data_stream
    - add_fields:
        fields:
          dataset: system.filesystem
        target: event
    - add_fields:
        fields:
          id: 79bd9b96-503a-4d0f-9e90-58adc53c4390
          snapshot: false
          version: 8.2.0
        target: elastic_agent
    - add_fields:
        fields:
          id: 79bd9b96-503a-4d0f-9e90-58adc53c4390
        target: agent
    revision: 1
  - id: system/metrics-system.fsstat-4139c70a-4563-44b6-8aeb-929382380f31
    index: metrics-system.fsstat-lxc
    meta:
      package:
        name: system
        version: 1.16.2
    metricsets:
    - fsstat
    module: system
    name: system-2
    period: 1m
    processors:
    - drop_event:
        when:
          regexp:
            system.fsstat.mount_point: ^/(sys|cgroup|proc|dev|etc|host|lib|snap)($|/)
    - add_fields:
        fields:
          dataset: system.fsstat
          namespace: lxc
          type: metrics
        target: data_stream
    - add_fields:
        fields:
          dataset: system.fsstat
        target: event
    - add_fields:
        fields:
          id: 79bd9b96-503a-4d0f-9e90-58adc53c4390
          snapshot: false
          version: 8.2.0
        target: elastic_agent
    - add_fields:
        fields:
          id: 79bd9b96-503a-4d0f-9e90-58adc53c4390
        target: agent
    revision: 1
  - id: system/metrics-system.load-4139c70a-4563-44b6-8aeb-929382380f31
    index: metrics-system.load-lxc
    meta:
      package:
        name: system
        version: 1.16.2
    metricsets:
    - load
    module: system
    name: system-2
    period: 10s
    processors:
    - add_fields:
        fields:
          dataset: system.load
          namespace: lxc
          type: metrics
        target: data_stream
    - add_fields:
        fields:
          dataset: system.load
        target: event
    - add_fields:
        fields:
          id: 79bd9b96-503a-4d0f-9e90-58adc53c4390
          snapshot: false
          version: 8.2.0
        target: elastic_agent
    - add_fields:
        fields:
          id: 79bd9b96-503a-4d0f-9e90-58adc53c4390
        target: agent
    revision: 1
  - id: system/metrics-system.memory-4139c70a-4563-44b6-8aeb-929382380f31
    index: metrics-system.memory-lxc
    meta:
      package:
        name: system
        version: 1.16.2
    metricsets:
    - memory
    module: system
    name: system-2
    period: 10s
    processors:
    - add_fields:
        fields:
          dataset: system.memory
          namespace: lxc
          type: metrics
        target: data_stream
    - add_fields:
        fields:
          dataset: system.memory
        target: event
    - add_fields:
        fields:
          id: 79bd9b96-503a-4d0f-9e90-58adc53c4390
          snapshot: false
          version: 8.2.0
        target: elastic_agent
    - add_fields:
        fields:
          id: 79bd9b96-503a-4d0f-9e90-58adc53c4390
        target: agent
    revision: 1
  - id: system/metrics-system.network-4139c70a-4563-44b6-8aeb-929382380f31
    index: metrics-system.network-lxc
    meta:
      package:
        name: system
        version: 1.16.2
    metricsets:
    - network
    module: system
    name: system-2
    network.interfaces: null
    period: 10s
    processors:
    - add_fields:
        fields:
          dataset: system.network
          namespace: lxc
          type: metrics
        target: data_stream
    - add_fields:
        fields:
          dataset: system.network
        target: event
    - add_fields:
        fields:
          id: 79bd9b96-503a-4d0f-9e90-58adc53c4390
          snapshot: false
          version: 8.2.0
        target: elastic_agent
    - add_fields:
        fields:
          id: 79bd9b96-503a-4d0f-9e90-58adc53c4390
        target: agent
    revision: 1
  - id: system/metrics-system.process-4139c70a-4563-44b6-8aeb-929382380f31
    index: metrics-system.process-lxc
    meta:
      package:
        name: system
        version: 1.16.2
    metricsets:
    - process
    module: system
    name: system-2
    period: 10s
    process.cgroups.enabled: false
    process.cmdline.cache.enabled: true
    process.include_cpu_ticks: false
    process.include_top_n.by_cpu: 5
    process.include_top_n.by_memory: 5
    processes:
    - .*
    processors:
    - add_fields:
        fields:
          dataset: system.process
          namespace: lxc
          type: metrics
        target: data_stream
    - add_fields:
        fields:
          dataset: system.process
        target: event
    - add_fields:
        fields:
          id: 79bd9b96-503a-4d0f-9e90-58adc53c4390
          snapshot: false
          version: 8.2.0
        target: elastic_agent
    - add_fields:
        fields:
          id: 79bd9b96-503a-4d0f-9e90-58adc53c4390
        target: agent
    revision: 1
  - id: system/metrics-system.process.summary-4139c70a-4563-44b6-8aeb-929382380f31
    index: metrics-system.process.summary-lxc
    meta:
      package:
        name: system
        version: 1.16.2
    metricsets:
    - process_summary
    module: system
    name: system-2
    period: 10s
    processors:
    - add_fields:
        fields:
          dataset: system.process.summary
          namespace: lxc
          type: metrics
        target: data_stream
    - add_fields:
        fields:
          dataset: system.process.summary
        target: event
    - add_fields:
        fields:
          id: 79bd9b96-503a-4d0f-9e90-58adc53c4390
          snapshot: false
          version: 8.2.0
        target: elastic_agent
    - add_fields:
        fields:
          id: 79bd9b96-503a-4d0f-9e90-58adc53c4390
        target: agent
    revision: 1
  - id: system/metrics-system.socket_summary-4139c70a-4563-44b6-8aeb-929382380f31
    index: metrics-system.socket_summary-lxc
    meta:
      package:
        name: system
        version: 1.16.2
    metricsets:
    - socket_summary
    module: system
    name: system-2
    period: 10s
    processors:
    - add_fields:
        fields:
          dataset: system.socket_summary
          namespace: lxc
          type: metrics
        target: data_stream
    - add_fields:
        fields:
          dataset: system.socket_summary
        target: event
    - add_fields:
        fields:
          id: 79bd9b96-503a-4d0f-9e90-58adc53c4390
          snapshot: false
          version: 8.2.0
        target: elastic_agent
    - add_fields:
        fields:
          id: 79bd9b96-503a-4d0f-9e90-58adc53c4390
        target: agent
    revision: 1
  - id: system/metrics-system.uptime-4139c70a-4563-44b6-8aeb-929382380f31
    index: metrics-system.uptime-lxc
    meta:
      package:
        name: system
        version: 1.16.2
    metricsets:
    - uptime
    module: system
    name: system-2
    period: 10s
    processors:
    - add_fields:
        fields:
          dataset: system.uptime
          namespace: lxc
          type: metrics
        target: data_stream
    - add_fields:
        fields:
          dataset: system.uptime
        target: event
    - add_fields:
        fields:
          id: 79bd9b96-503a-4d0f-9e90-58adc53c4390
          snapshot: false
          version: 8.2.0
        target: elastic_agent
    - add_fields:
        fields:
          id: 79bd9b96-503a-4d0f-9e90-58adc53c4390
        target: agent
    revision: 1

Thanks for the clarification. Unfortunately I can't get it to work.

  1. git clone https://github.com/deviantony/docker-elk
  2. docker-compose up -d
  3. Login with elastic and changeme
  4. Switch to fleet. Setup fleet server on network ip of elastic:8220
  5. Copy paste commands to install fleet server
  6. Install elastic agents by following Add Agent, adding --insecure to last command
  7. Agents appear in menu. Last check for incoming data never fullfills (even after 10 minute waiting)

Agent logs:

Agent dashboard:

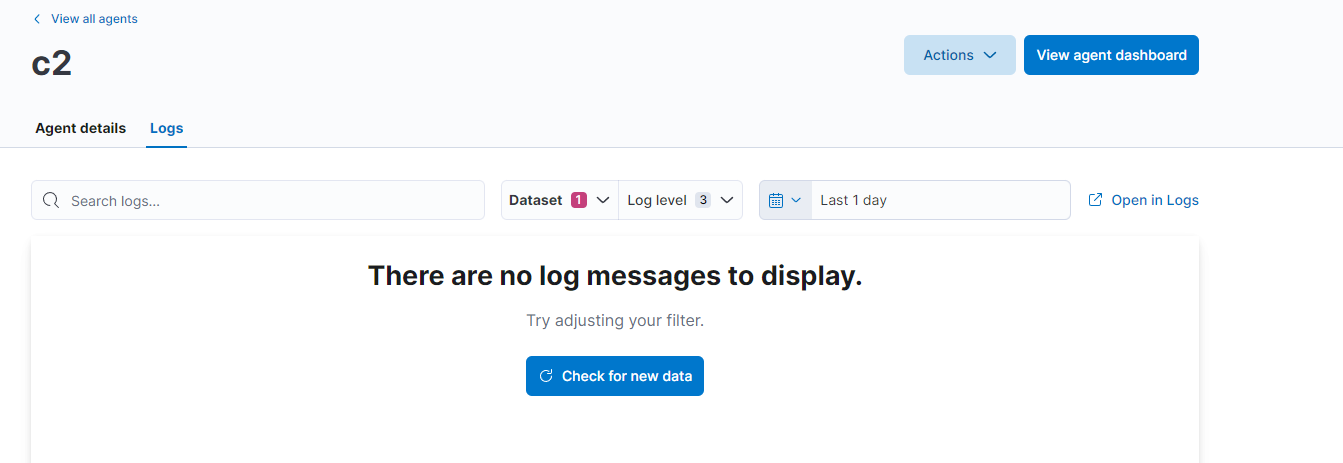
Do you know what I'm doing wrong? The fleet server says:

18:08:38.520 elastic_agent [elastic_agent][info] No events received within 10m0s, restarting watch call

18:18:48.520 elastic_agent [elastic_agent][info] No events received within 10m0s, restarting watch call

That is odd. It looks like the Beats cannot communicate with Elasticsearch.

Go to the instance where the Elastic-Agent is installed. If you installed on a Linux host, it will be on /opt/Elastic/Agent, then run elastic-agent diagnostics collect . This will generate a zip file with all the configs and logs from Elastic-Agent and Beats.

Look for error message in the logs, and check the URLs and credentials configured for Beats are correct.

I don't know this Docker compose you're using, there is a chance some of its default configurations use a internal docker hostname or some ports are not fully exposed.

You're right. I don't really know how to solve the communication. I guess it's better to follow your setup. How did you setup the elk stack?

I used Ealstic-Cloud: Elastic Cloud: Hosted Elasticsearch, Hosted Search | Elastic, then added an Elastic-Agent with the default policy.

But if you want to host yourself, you can just download the tar.gz version of Elasticsearch and Kibana and set them up "manually". There are a number of steps to follow, but it's not hard, keep the default security/SSL settings and follow the documentation.

By having everything running directly on your machine it should make debugging connection issues easy.

This topic was automatically closed 28 days after the last reply. New replies are no longer allowed.