Hi,
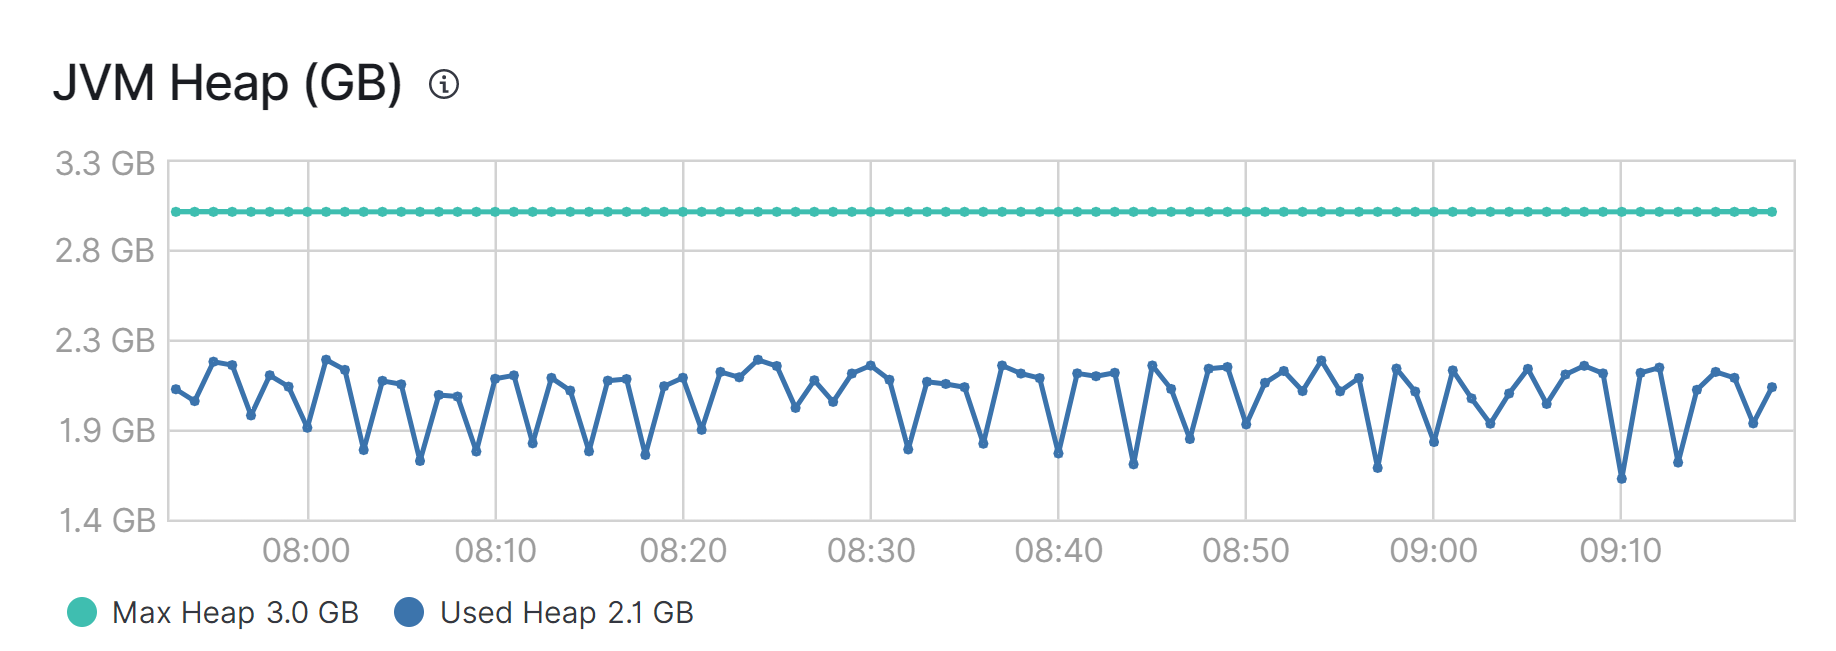
my used JVM Heap behaves very weird. I didn't change any settings. 2 Nodes work fine, the third has problems.

(Orange Line)

Settings:
-Xms3g
-Xmx3g
The PC has a lot of free RAM left.

What is happening here?
Thanks,
defalt
It's not clear what problems you have here sorry.
What is the output of the cluster stats API?
{
"_nodes": {
"total": 3,
"successful": 3,
"failed": 0
},
"cluster_name": "dc-world",
"cluster_uuid": "wLeROlF5Tx6OMYftWH6U3Q",
"timestamp": 1595311712215,
"status": "green",
"indices": {
"count": 45,
"shards": {
"total": 146,
"primaries": 73,
"replication": 1,
"index": {
"shards": {
"min": 2,
"max": 10,
"avg": 3.2444444444444445
},
"primaries": {
"min": 1,
"max": 5,
"avg": 1.6222222222222222
},
"replication": {
"min": 1,
"max": 1,
"avg": 1
}
}
},
"docs": {
"count": 818506112,
"deleted": 2226751
},
"store": {
"size_in_bytes": 497094462921
},
"fielddata": {
"memory_size_in_bytes": 48104,
"evictions": 0
},
"query_cache": {
"memory_size_in_bytes": 2539645,
"total_count": 908225,
"hit_count": 298795,
"miss_count": 609430,
"cache_size": 166,
"cache_count": 4786,
"evictions": 4620
},
"completion": {
"size_in_bytes": 0
},
"segments": {
"count": 1882,
"memory_in_bytes": 243464880,
"terms_memory_in_bytes": 4960864,
"stored_fields_memory_in_bytes": 231750528,
"term_vectors_memory_in_bytes": 0,
"norms_memory_in_bytes": 267520,
"points_memory_in_bytes": 0,
"doc_values_memory_in_bytes": 6485968,
"index_writer_memory_in_bytes": 12315080,
"version_map_memory_in_bytes": 260,
"fixed_bit_set_memory_in_bytes": 1089496,
"max_unsafe_auto_id_timestamp": 1595289610086,
"file_sizes": {}
},
"mappings": {
"field_types": [
{
"name": "alias",
"count": 69,
"index_count": 1
},
{
"name": "binary",
"count": 13,
"index_count": 4
},
{
"name": "boolean",
"count": 195,
"index_count": 27
},
{
"name": "date",
"count": 247,
"index_count": 38
},
{
"name": "date_range",
"count": 1,
"index_count": 1
},
{
"name": "double",
"count": 1,
"index_count": 1
},
{
"name": "flattened",
"count": 3,
"index_count": 3
},
{
"name": "float",
"count": 205,
"index_count": 20
},
{
"name": "geo_point",
"count": 14,
"index_count": 2
},
{
"name": "geo_shape",
"count": 3,
"index_count": 3
},
{
"name": "half_float",
"count": 59,
"index_count": 15
},
{
"name": "integer",
"count": 235,
"index_count": 16
},
{
"name": "ip",
"count": 40,
"index_count": 2
},
{
"name": "keyword",
"count": 2581,
"index_count": 43
},
{
"name": "long",
"count": 1982,
"index_count": 32
},
{
"name": "nested",
"count": 45,
"index_count": 13
},
{
"name": "object",
"count": 1902,
"index_count": 31
},
{
"name": "text",
"count": 517,
"index_count": 34
}
]
},
"analysis": {
"char_filter_types": [
{
"name": "pattern_replace",
"count": 4,
"index_count": 2
}
],
"tokenizer_types": [],
"filter_types": [
{
"name": "pattern_capture",
"count": 1,
"index_count": 1
},
{
"name": "shingle",
"count": 2,
"index_count": 2
}
],
"analyzer_types": [
{
"name": "custom",
"count": 1,
"index_count": 1
}
],
"built_in_char_filters": [],
"built_in_tokenizers": [
{
"name": "uax_url_email",
"count": 1,
"index_count": 1
}
],
"built_in_filters": [
{
"name": "lowercase",
"count": 1,
"index_count": 1
},
{
"name": "unique",
"count": 1,
"index_count": 1
}
],
"built_in_analyzers": [
{
"name": "simple",
"count": 4,
"index_count": 1
}
]
}
},
"nodes": {
"count": {
"total": 3,
"coordinating_only": 0,
"data": 3,
"ingest": 3,
"master": 3,
"ml": 3,
"remote_cluster_client": 3,
"transform": 3,
"voting_only": 0
},
"versions": [
"7.8.0"
],
"os": {
"available_processors": 24,
"allocated_processors": 24,
"names": [
{
"name": "Windows 10",
"count": 2
},
{
"name": "Windows 7",
"count": 1
}
],
"pretty_names": [
{
"pretty_name": "Windows 7",
"count": 1
},
{
"pretty_name": "Windows 10",
"count": 2
}
],
"mem": {
"total_in_bytes": 42440687616,
"free_in_bytes": 19766992896,
"used_in_bytes": 22673694720,
"free_percent": 47,
"used_percent": 53
}
},
"process": {
"cpu": {
"percent": 1
},
"open_file_descriptors": {
"min": -1,
"max": -1,
"avg": 0
}
},
"jvm": {
"max_uptime_in_millis": 71124807,
"versions": [
{
"version": "14.0.1",
"vm_name": "OpenJDK 64-Bit Server VM",
"vm_version": "14.0.1+7",
"vm_vendor": "AdoptOpenJDK",
"bundled_jdk": true,
"using_bundled_jdk": true,
"count": 2
},
{
"version": "11.0.7",
"vm_name": "OpenJDK 64-Bit Server VM",
"vm_version": "11.0.7+10",
"vm_vendor": "AdoptOpenJDK",
"bundled_jdk": true,
"using_bundled_jdk": false,
"count": 1
}
],
"mem": {
"heap_used_in_bytes": 5258006344,
"heap_max_in_bytes": 9593946112
},
"threads": 317
},
"fs": {
"total_in_bytes": 2988491104256,
"free_in_bytes": 1531093913600,
"available_in_bytes": 1531093913600
},
"plugins": [],
"network_types": {
"transport_types": {
"security4": 3
},
"http_types": {
"security4": 3
}
},
"discovery_types": {
"zen": 3
},
"packaging_types": [
{
"flavor": "default",
"type": "zip",
"count": 3
}
],
"ingest": {
"number_of_pipelines": 2,
"processor_stats": {
"gsub": {
"count": 0,
"failed": 0,
"current": 0,
"time_in_millis": 0
},
"script": {
"count": 0,
"failed": 0,
"current": 0,
"time_in_millis": 0
}
}
}
}
}
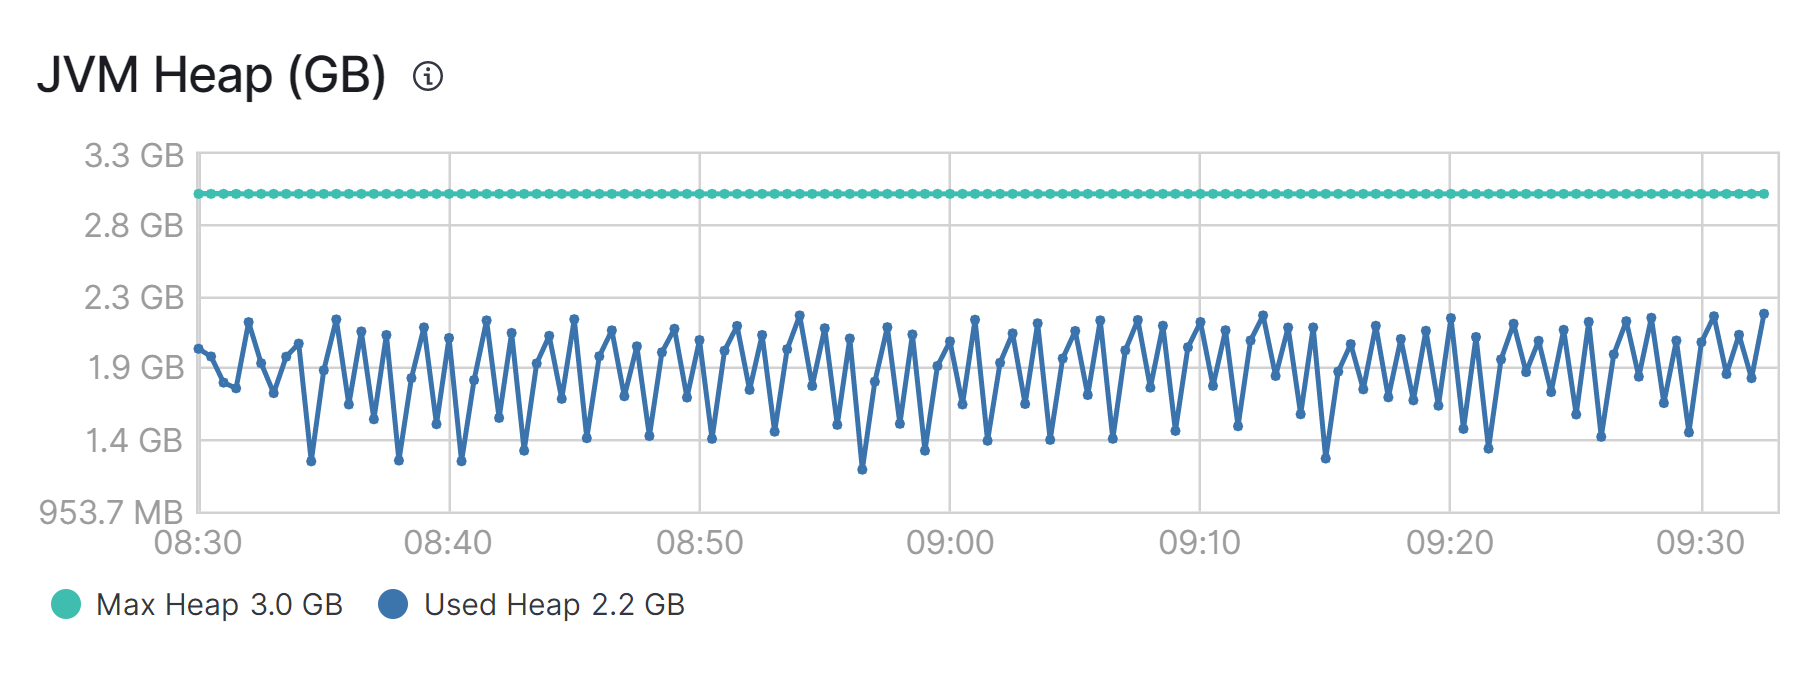
Behavior still the same but it slowly increased from 500-1000MB to 1000-1500MB:
Thanks
You have one node running Java11 while the other run Java14. Can you check if the one behaving different is the Java11 one? Are there any differences in JVM options between the nodes?
I would recommend having all nodes run on the same Java version.
I spoke too soon! The faulty node works now but the other two now ran into the same problem:
This was the faulty one:
Cluster stats:
{
"_nodes": {
"total": 3,
"successful": 3,
"failed": 0
},
"cluster_name": "dc-world",
"cluster_uuid": "wLeROlF5Tx6OMYftWH6U3Q",
"timestamp": 1595315980994,
"status": "green",
"indices": {
"count": 45,
"shards": {
"total": 146,
"primaries": 73,
"replication": 1,
"index": {
"shards": {
"min": 2,
"max": 10,
"avg": 3.2444444444444445
},
"primaries": {
"min": 1,
"max": 5,
"avg": 1.6222222222222222
},
"replication": {
"min": 1,
"max": 1,
"avg": 1
}
}
},
"docs": {
"count": 818531250,
"deleted": 2286159
},
"store": {
"size_in_bytes": 497196443225
},
"fielddata": {
"memory_size_in_bytes": 45144,
"evictions": 0
},
"query_cache": {
"memory_size_in_bytes": 25784721,
"total_count": 537148,
"hit_count": 150278,
"miss_count": 386870,
"cache_size": 1851,
"cache_count": 4741,
"evictions": 2890
},
"completion": {
"size_in_bytes": 0
},
"segments": {
"count": 1881,
"memory_in_bytes": 243418500,
"terms_memory_in_bytes": 4959392,
"stored_fields_memory_in_bytes": 231750008,
"term_vectors_memory_in_bytes": 0,
"norms_memory_in_bytes": 267520,
"points_memory_in_bytes": 0,
"doc_values_memory_in_bytes": 6441580,
"index_writer_memory_in_bytes": 5050760,
"version_map_memory_in_bytes": 0,
"fixed_bit_set_memory_in_bytes": 1068520,
"max_unsafe_auto_id_timestamp": 1595312772667,
"file_sizes": {}
},
"mappings": {
"field_types": [
{
"name": "alias",
"count": 69,
"index_count": 1
},
{
"name": "binary",
"count": 13,
"index_count": 4
},
{
"name": "boolean",
"count": 195,
"index_count": 27
},
{
"name": "date",
"count": 247,
"index_count": 38
},
{
"name": "date_range",
"count": 1,
"index_count": 1
},
{
"name": "double",
"count": 1,
"index_count": 1
},
{
"name": "flattened",
"count": 3,
"index_count": 3
},
{
"name": "float",
"count": 205,
"index_count": 20
},
{
"name": "geo_point",
"count": 14,
"index_count": 2
},
{
"name": "geo_shape",
"count": 3,
"index_count": 3
},
{
"name": "half_float",
"count": 59,
"index_count": 15
},
{
"name": "integer",
"count": 235,
"index_count": 16
},
{
"name": "ip",
"count": 40,
"index_count": 2
},
{
"name": "keyword",
"count": 2581,
"index_count": 43
},
{
"name": "long",
"count": 1982,
"index_count": 32
},
{
"name": "nested",
"count": 45,
"index_count": 13
},
{
"name": "object",
"count": 1902,
"index_count": 31
},
{
"name": "text",
"count": 517,
"index_count": 34
}
]
},
"analysis": {
"char_filter_types": [
{
"name": "pattern_replace",
"count": 4,
"index_count": 2
}
],
"tokenizer_types": [],
"filter_types": [
{
"name": "pattern_capture",
"count": 1,
"index_count": 1
},
{
"name": "shingle",
"count": 2,
"index_count": 2
}
],
"analyzer_types": [
{
"name": "custom",
"count": 1,
"index_count": 1
}
],
"built_in_char_filters": [],
"built_in_tokenizers": [
{
"name": "uax_url_email",
"count": 1,
"index_count": 1
}
],
"built_in_filters": [
{
"name": "lowercase",
"count": 1,
"index_count": 1
},
{
"name": "unique",
"count": 1,
"index_count": 1
}
],
"built_in_analyzers": [
{
"name": "simple",
"count": 4,
"index_count": 1
}
]
}
},
"nodes": {
"count": {
"total": 3,
"coordinating_only": 0,
"data": 3,
"ingest": 3,
"master": 3,
"ml": 3,
"remote_cluster_client": 3,
"transform": 3,
"voting_only": 0
},
"versions": [
"7.8.0"
],
"os": {
"available_processors": 24,
"allocated_processors": 24,
"names": [
{
"name": "Windows 10",
"count": 2
},
{
"name": "Windows 7",
"count": 1
}
],
"pretty_names": [
{
"pretty_name": "Windows 7",
"count": 1
},
{
"pretty_name": "Windows 10",
"count": 2
}
],
"mem": {
"total_in_bytes": 42440687616,
"free_in_bytes": 19452805120,
"used_in_bytes": 22987882496,
"free_percent": 46,
"used_percent": 54
}
},
"process": {
"cpu": {
"percent": 3
},
"open_file_descriptors": {
"min": -1,
"max": -1,
"avg": 0
}
},
"jvm": {
"max_uptime_in_millis": 75393104,
"versions": [
{
"version": "14.0.1",
"vm_name": "OpenJDK 64-Bit Server VM",
"vm_version": "14.0.1+7",
"vm_vendor": "AdoptOpenJDK",
"bundled_jdk": true,
"using_bundled_jdk": true,
"count": 3
}
],
"mem": {
"heap_used_in_bytes": 4168996024,
"heap_max_in_bytes": 9663676416
},
"threads": 311
},
"fs": {
"total_in_bytes": 2988491104256,
"free_in_bytes": 1531115847680,
"available_in_bytes": 1531115847680
},
"plugins": [],
"network_types": {
"transport_types": {
"security4": 3
},
"http_types": {
"security4": 3
}
},
"discovery_types": {
"zen": 3
},
"packaging_types": [
{
"flavor": "default",
"type": "zip",
"count": 3
}
],
"ingest": {
"number_of_pipelines": 2,
"processor_stats": {
"gsub": {
"count": 0,
"failed": 0,
"current": 0,
"time_in_millis": 0
},
"script": {
"count": 0,
"failed": 0,
"current": 0,
"time_in_millis": 0
}
}
}
}
}
What does your JVM.options files look like? Are you using the settings that come with Elasticsearch 7.8 on Java14?
JVM Node 1:
## JVM configuration

################################################################
## IMPORTANT: JVM heap size
################################################################
##
## You should always set the min and max JVM heap
## size to the same value. For example, to set
## the heap to 4 GB, set:
##
## -Xms4g
## -Xmx4g
##
## See https://www.elastic.co/guide/en/elasticsearch/reference/current/heap-size.html
## for more information
##
################################################################

# Xms represents the initial size of total heap space
# Xmx represents the maximum size of total heap space

-Xms3g
-Xmx3g

################################################################
## Expert settings
################################################################
##
## All settings below this section are considered
## expert settings. Don't tamper with them unless
## you understand what you are doing
##
################################################################

## GC configuration
8-13:-XX:+UseConcMarkSweepGC
8-13:-XX:CMSInitiatingOccupancyFraction=75
8-13:-XX:+UseCMSInitiatingOccupancyOnly

## G1GC Configuration
# NOTE: G1 GC is only supported on JDK version 10 or later
# to use G1GC, uncomment the next two lines and update the version on the
# following three lines to your version of the JDK
# 10-13:-XX:-UseConcMarkSweepGC
# 10-13:-XX:-UseCMSInitiatingOccupancyOnly
14-:-XX:+UseG1GC
14-:-XX:G1ReservePercent=25
14-:-XX:InitiatingHeapOccupancyPercent=30

## JVM temporary directory
-Djava.io.tmpdir=${ES_TMPDIR}

## heap dumps

# generate a heap dump when an allocation from the Java heap fails
# heap dumps are created in the working directory of the JVM
-XX:+HeapDumpOnOutOfMemoryError

# specify an alternative path for heap dumps; ensure the directory exists and
# has sufficient space
-XX:HeapDumpPath=data

# specify an alternative path for JVM fatal error logs
-XX:ErrorFile=logs/hs_err_pid%p.log

## JDK 8 GC logging
8:-XX:+PrintGCDetails
8:-XX:+PrintGCDateStamps
8:-XX:+PrintTenuringDistribution
8:-XX:+PrintGCApplicationStoppedTime
8:-Xloggc:logs/gc.log
8:-XX:+UseGCLogFileRotation
8:-XX:NumberOfGCLogFiles=32
8:-XX:GCLogFileSize=64m

# JDK 9+ GC logging
9-:-Xlog:gc*,gc+age=trace,safepoint:file=logs/gc.log:utctime,pid,tags:filecount=32,filesize=64m
JVM on the node which had the problem (Haven't changed anything to fix the issue):
## JVM configuration

################################################################
## IMPORTANT: JVM heap size
################################################################
##
## You should always set the min and max JVM heap
## size to the same value. For example, to set
## the heap to 4 GB, set:
##
## -Xms4g
## -Xmx4g
##
## See https://www.elastic.co/guide/en/elasticsearch/reference/current/heap-size.html
## for more information
##
################################################################

# Xms represents the initial size of total heap space
# Xmx represents the maximum size of total heap space

-Xms3g
-Xmx3g

################################################################
## Expert settings
################################################################
##
## All settings below this section are considered
## expert settings. Don't tamper with them unless
## you understand what you are doing
##
################################################################

## GC configuration
8-13:-XX:+UseConcMarkSweepGC
8-13:-XX:CMSInitiatingOccupancyFraction=75
8-13:-XX:+UseCMSInitiatingOccupancyOnly

## G1GC Configuration
# NOTE: G1 GC is only supported on JDK version 10 or later
# to use G1GC, uncomment the next two lines and update the version on the
# following three lines to your version of the JDK
# 10-13:-XX:-UseConcMarkSweepGC
# 10-13:-XX:-UseCMSInitiatingOccupancyOnly
14-:-XX:+UseG1GC
14-:-XX:G1ReservePercent=25
14-:-XX:InitiatingHeapOccupancyPercent=30

## JVM temporary directory
-Djava.io.tmpdir=${ES_TMPDIR}

## heap dumps

# generate a heap dump when an allocation from the Java heap fails
# heap dumps are created in the working directory of the JVM
-XX:+HeapDumpOnOutOfMemoryError

# specify an alternative path for heap dumps; ensure the directory exists and
# has sufficient space
-XX:HeapDumpPath=data

# specify an alternative path for JVM fatal error logs
-XX:ErrorFile=logs/hs_err_pid%p.log

## JDK 8 GC logging
8:-XX:+PrintGCDetails
8:-XX:+PrintGCDateStamps
8:-XX:+PrintTenuringDistribution
8:-XX:+PrintGCApplicationStoppedTime
8:-Xloggc:logs/gc.log
8:-XX:+UseGCLogFileRotation
8:-XX:NumberOfGCLogFiles=32
8:-XX:GCLogFileSize=64m

# JDK 9+ GC logging
9-:-Xlog:gc*,gc+age=trace,safepoint:file=logs/gc.log:utctime,pid,tags:filecount=32,filesize=64m
Last Node:
## JVM configuration

################################################################
## IMPORTANT: JVM heap size
################################################################
##
## You should always set the min and max JVM heap
## size to the same value. For example, to set
## the heap to 4 GB, set:
##
## -Xms4g
## -Xmx4g
##
## See https://www.elastic.co/guide/en/elasticsearch/reference/current/heap-size.html
## for more information
##
################################################################

# Xms represents the initial size of total heap space
# Xmx represents the maximum size of total heap space

-Xms3g
-Xmx3g

################################################################
## Expert settings
################################################################
##
## All settings below this section are considered
## expert settings. Don't tamper with them unless
## you understand what you are doing
##
################################################################

## GC configuration
8-13:-XX:+UseConcMarkSweepGC
8-13:-XX:CMSInitiatingOccupancyFraction=75
8-13:-XX:+UseCMSInitiatingOccupancyOnly

## G1GC Configuration
# NOTE: G1 GC is only supported on JDK version 10 or later
# to use G1GC, uncomment the next two lines and update the version on the
# following three lines to your version of the JDK
# 10-13:-XX:-UseConcMarkSweepGC
# 10-13:-XX:-UseCMSInitiatingOccupancyOnly
14-:-XX:+UseG1GC
14-:-XX:G1ReservePercent=25
14-:-XX:InitiatingHeapOccupancyPercent=30

## JVM temporary directory
-Djava.io.tmpdir=${ES_TMPDIR}

## heap dumps

# generate a heap dump when an allocation from the Java heap fails
# heap dumps are created in the working directory of the JVM
-XX:+HeapDumpOnOutOfMemoryError

# specify an alternative path for heap dumps; ensure the directory exists and
# has sufficient space
-XX:HeapDumpPath=data

# specify an alternative path for JVM fatal error logs
-XX:ErrorFile=logs/hs_err_pid%p.log

## JDK 8 GC logging
8:-XX:+PrintGCDetails
8:-XX:+PrintGCDateStamps
8:-XX:+PrintTenuringDistribution
8:-XX:+PrintGCApplicationStoppedTime
8:-Xloggc:logs/gc.log
8:-XX:+UseGCLogFileRotation
8:-XX:NumberOfGCLogFiles=32
8:-XX:GCLogFileSize=64m

# JDK 9+ GC logging
9-:-Xlog:gc*,gc+age=trace,safepoint:file=logs/gc.log:utctime,pid,tags:filecount=32,filesize=64m
As far as I know I haven't changed anything other than XMS and XMG
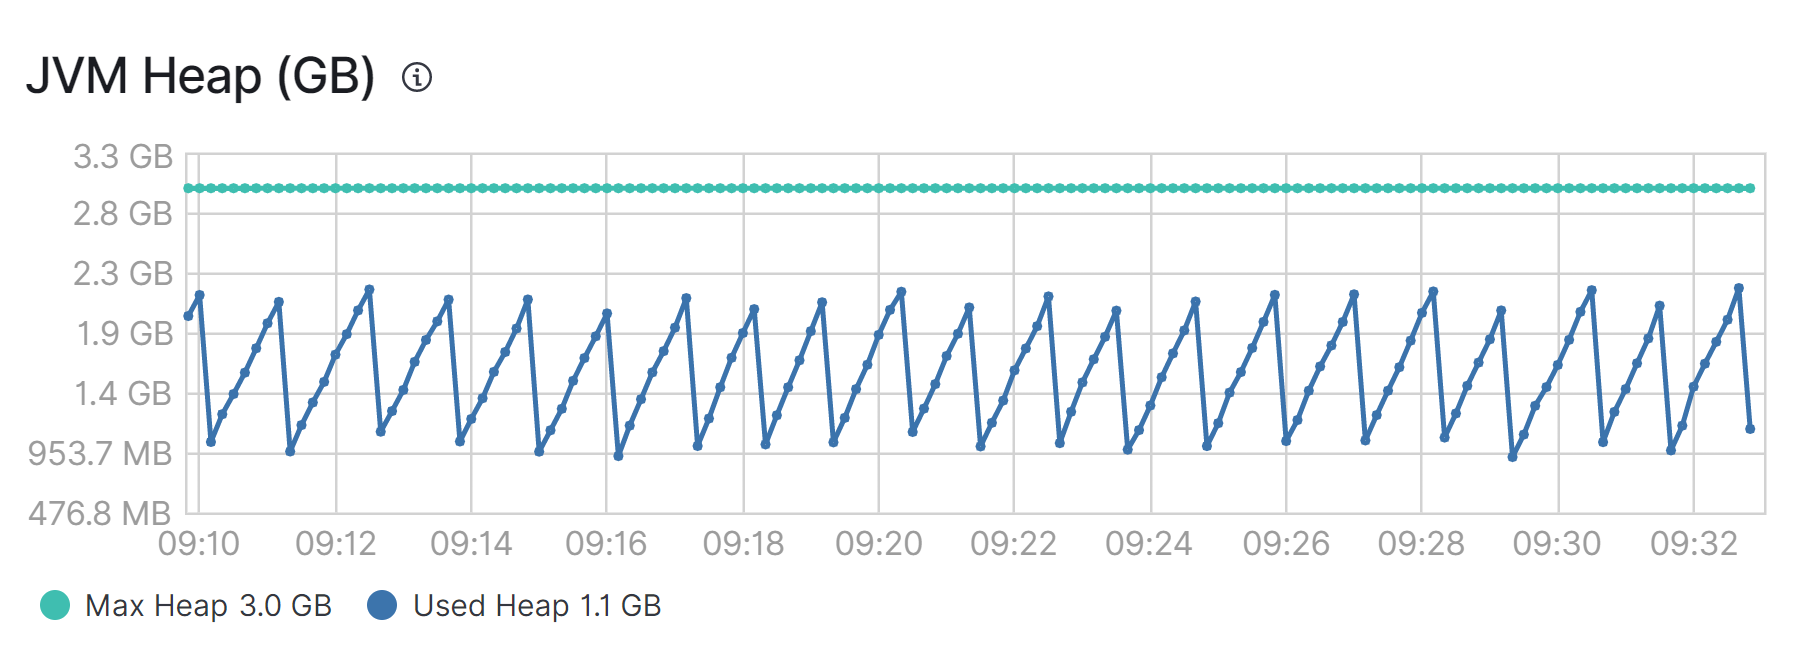
EDIT
When zoomed in the collector looks pretty normal. Maybe it just looks bad because of the aggregation?
Zooming in:
What I noticed is that the collector on the two nodes now collects more often. Is this a problem?
10min of collecting before changes on the faulty node:
That looks like pretty typical garbage collection to me. Is it causing actual problems?
As for what I can see it doesn't cause problems. It was just weird that the cycle changed so drastically only because I changed the Java version on one node.
Thanks for your info.
© 2020. All Rights Reserved - Elasticsearch
Apache, Apache Lucene, Apache Hadoop, Hadoop, HDFS and the yellow elephant logo are trademarks of the Apache Software Foundation in the United States and/or other countries.