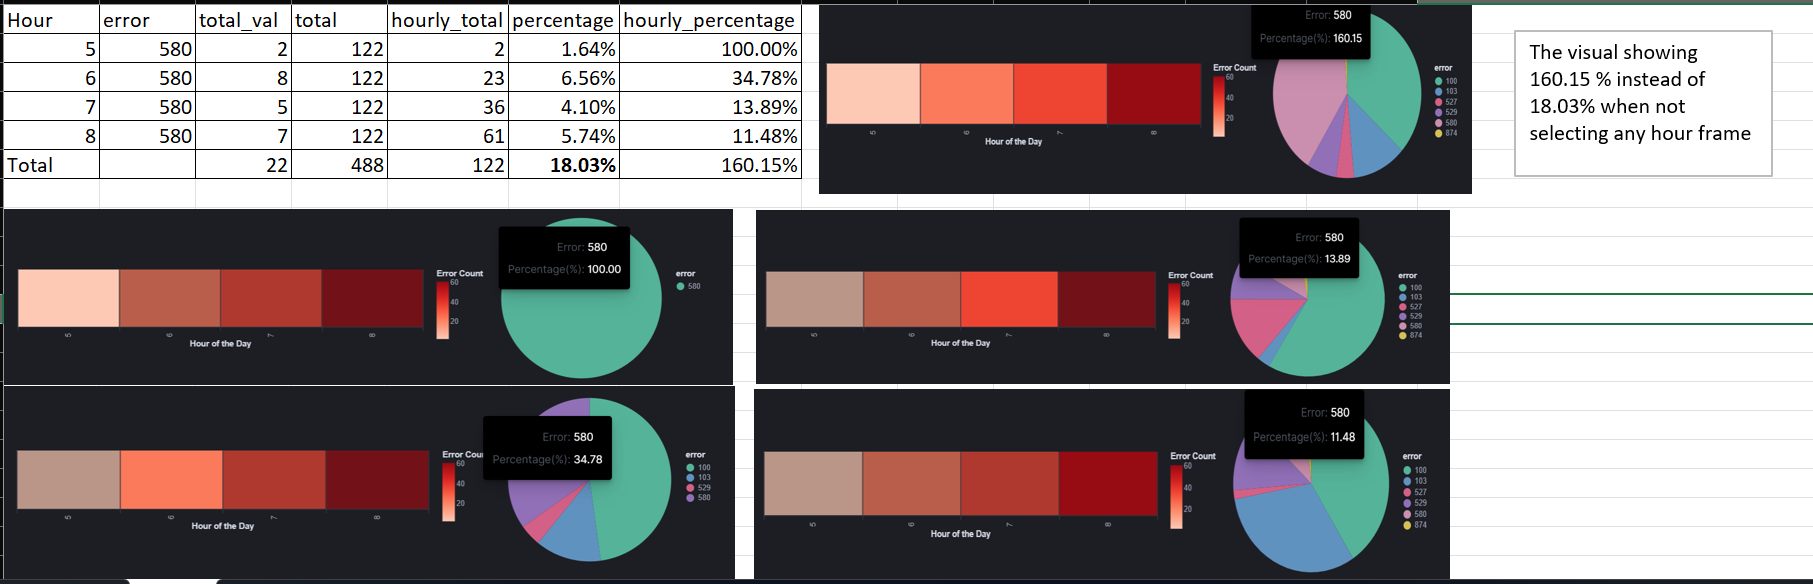
I created a heatmap which is showing the failed transaction in hour bucket, and pie chart showing the error-code contributions. When I select any hour bucket in heatmap then it showing the correct error contribution in pie but when I don't select any hour bucket in heatmap then it is showing the summation of all the hour bucket for each error contribution . As my heatmap is divided into hourly bucket and I filter the global time as "last 10 hour" then my heatmap shows 10 bucket for each hour but my pie shows the summation of these 10 hour bucket for each error rather I want aggregated value of each error for 10 hour bucket. I want to use "hourly_percentage" in pie chart when I select any hour bucket in heatmap, but when I don't select any hour bucket in heatmap I want to use "percentage" in pie chart.
{
	"$schema": "https://vega.github.io/schema/vega-lite/v2.json",
	# "autosize": "none",

	"data": {
		"url": {
		  "%context%": true,
		  "%timefield%": "datetime",
		  "%timefilter%": "min",
		  "%timefilter%": "max",
		  "index": "index1",
		  "body": {
			"size": 0,
			"aggs": {
			  "two": {
				"date_histogram": {
				  "field": "datetime",
				  "fixed_interval": "30m",
				  "time_zone": "UTC",
				  "min_doc_count": 1
				},
				"aggs": {
				  "three": {
					"terms": {
					  "field": "error",
					  "order": {
						"_key": "desc"
					  },
					  "size": 5
					},
					"aggs": {
					  "one": {
						"sum_bucket": {
						  "buckets_path": "one-bucket>_count"
						}
					  },
					  "one-bucket": {
						"filters": {
						  "filters": {
							"status : \"Fail\" ": {
							  "bool": {
								"must": [],
								"filter": [
								  {
									"bool": {
									  "should": [
										{
										  "match_phrase": {
											"status": "Fail"
										  }
										}
									  ],
									  "minimum_should_match": 1
									}
								  }
								],
								"should": [],
								"must_not": []
							  }
							}
						  }
						}
					  }
					}
				  }
				}
			  }
			}
		  }
		},
		"format": { "property": "aggregations.two.buckets", "type": "json" }
	  },
	  "transform": [
		{
		  "flatten": ["three.buckets"],
		  "as": ["new_buckets"]
		},
		{ "calculate": "utchours(datum.key_as_string)", "as": "hour" },
		{ "calculate": "datum.new_buckets.key", "as": "error" },
		{ "calculate": "datum.new_buckets.one.value", "as": "fail_txn" },
		 { "filter": "datum.fail_txn > 0" },
		{"filter": "datum.error>0"}
		{
		  "aggregate": [
			{"op": "sum","field": "fail_txn", "as": "total_val"}
		  ],
		  "groupby": ["hour","error"]
		},
		{
		  "joinaggregate": [
			{"op": "sum", "field": "total_val", "as": "total"}
		  ]
		},
		{
		  "joinaggregate": [
			{"op": "sum", "field": "total_val", "as": "hourly_total"}
		  ],
		   "groupby": ["hour"]
		},
		{
		  "calculate": "(datum.total_val / datum.total)*100",
		  "as": "percentage"
		},
		{
		  "calculate": "(datum.total_val / datum.hourly_total)*100",
		  "as": "hourly_percentage"
		}
	  ],

	"columns": 2,
	  "concat": [{
		  "selection": {
			"click": {"type": "multi","encodings": ["x"], "nearest": false, "on": "click"}
		  },
		  "mark": "rect",
		  "width": "530",
		  "height": 75,
		  "encoding": {
			"x": {"field": "hour", "type": "ordinal", "title": "Hour of the Day"},
			"color": {
			  "field": "total_val",
			  "aggregate": "sum",
			  "type": "quantitative",
			  "title": "Error Count",
			  "scale": {"scheme": "reds", "reverse": false},
				 "legend": {
		  "symbolOpacity": 1,
		  "orient": "right",
		  "direction": "vertical",
		 "columns": 5
		}
			},
			"tooltip": [
			  {"field": "hour", "title": "Hour"},
			  {"field": "total_val", "aggregate": "sum", "type": "quantitative", "title": "Count"}
			],

			"opacity": {
			  "condition": {"selection": "click", "value": 1},
			  "value": 0.7
			}
		  }
		},
		{
		  "mark": {"type": "arc", "radius":105},
		   "width": 211,
		  "height": 75,
		  "encoding": {
			"theta": {"field": "hourly_percentage","aggregate":"sum", "type": "quantitative","stack": "normalize"},
		"color": {"field": "error", "type": "nominal", "format": ".2f"}
			"tooltip": [
			  {"field": "error", "type": "nominal", "title": "Error"},
			  {"field": "hourly_percentage", "type": "quantitative","aggregate":"sum", "title": "Percentage(%)", "format": ".2f"},

			]
		  },
		  "transform": [
			{
			  "joinaggregate": [{"op": "sum","field": "fail_txn"}],
			  "groupby": ["error_code"]
			},
			{"filter": {"selection": "click"}}
		  ]
		}
	  ],
	   "resolve": {"axis": {"x": "independent"}},
	   "config": {
	   "view": {"stroke": "transparent"},
	   "axis": {"grid": true, "tickBand": "extent"}
	   }
	}