I have very limited data in Elastic search. I have hosted my elastic search in VM. Most of the time Java usage more CPU usage. So My site getting slow due to this.
My elastic search version - 2.3.2
Why it happen and i didn't change anything in my elastic search. All the configuration in default only. but jave.exe use CPU from 84 to 96%.
Could you please suggest what i do to reduce this. Some times it reduced (when restart the VM)
Thanks for response. Problem with upgrade is comparing new version and 2.3.2 lot of ES architecture changed, So we have to modify total architecture for our application when upgrade like Elastic search API access, Add, update and delete logic too. It may impact our DB architecture too. That why we afraid about upgrade.
Can you let us know, possible steps to optimize CPU usage and why it reduced when restarted the VM sometime
I also have one application with an old 2.x version and even one with 1.x and can't upgrade for lot of different reasons (acually I already upgrade form 0.9 to 1.x but can't go to more recent because of the scripts )!
We also encounter some high CPU (long time ago) and as warkolm point it you need to check the number of shards... We may have different problem but in my case when we reached high CPU we droped some old and useless small indices.
Thanks to curator it's automatic so now we no more have this high CPU problems!
An other problem was one index had ~40% or 50% of deleted documents. You can also check the deleted documents ratio.
Hi @warkolm
This is we have : :{"total":20,"successful":10,"failed":0},
Also we have 9 indices. Maximum document size is 14MB. Where i get logs?
Which one help for us, reduce heap / increase heap?
Hi @warkolm
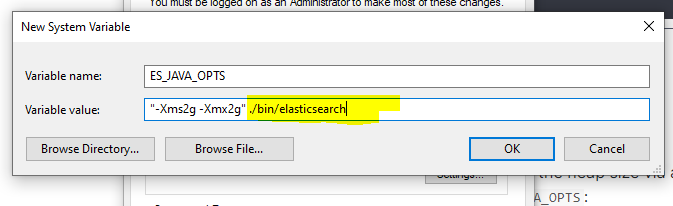
Final clarification, is this correct way to update the Heap size, Whether we have to mention bin path name when update environment variable? image|673x206. Since i am not expert in JAVA configuration. Also how we confirm current elastic search heap size?
I am thinking so but in windows this is the way for set environment variable. I cannot find config file in bin folder as well, I don't know where i need to place the code for elasticsearch file.
Can you please let me know, steps to find existing heap size for elastic search?
I checked on my instance but it's under linux so for Windows it's maybe different.
Heap size is defined in /etc/sysconfig/elasticsearch file.
Here how it appear in the file.
# Heap size defaults to 256m min, 1g max
# Set ES_HEAP_SIZE to 50% of available RAM, but no more than 31g
ES_HEAP_SIZE=2g
For me others options are all by defaults and except the number or shards and number of deleted documents problem that happened early, so far it run from a couple of years without any problem.
Apache, Apache Lucene, Apache Hadoop, Hadoop, HDFS and the yellow elephant
logo are trademarks of the
Apache Software Foundation
in the United States and/or other countries.

 )!
)!
