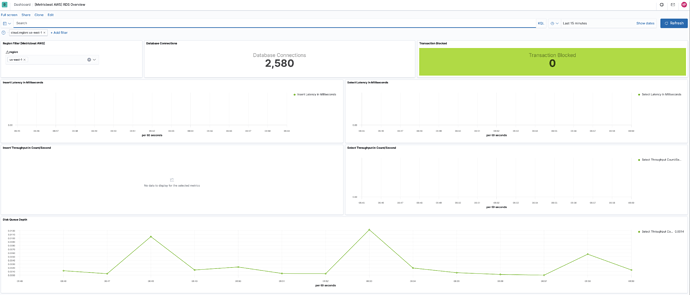
Hello, I just setup a way to import data from aws rds in elasticsearch so that I can get some nice dashboards but the visualisations are completely broken. I had to edit most of te visualizations and add the fields which I thought that should be there to make them work.
Sorry, I dont understand your question. What is metricbeat rds means? When you try to import data ( via- saved objects? ) your visualizations are broken ? Is that right ? What version of the stack are you on? What do kibana logs indicate when you try and import the data ?
Thanks
Rashmi
you are offering in metricbeat aws/rds metrics (amazon hosted database service). Also kibana has some dashboards for those metrics. But the visualizations does not work out of the box. They need editing which would not be a problem if there would be a description on what exactly needs to be visualized. Some of the visualizations I was not able to fix.
@lukas - can u plz help here?
which visualizations don't work ? Can you plz be more specific ?- Version, steps taken , screenshots, would help.
Also how did you determine that they were broken ? did you try to export/import them ? What do Kibana logs indicate
Thanks
Rashmi
As you can see the attached screenshots some of the visualizations are having no data. Also on the bottom screenshot if I go and edit the visualization as it can be seen no metrics is set up. The ones which has data were also empty but I managed to fix them by manually editing the visualization but these four I was not able to have them work. I also deleted all the data and imported again running metricbeat setup but it did not help.
This topic was automatically closed 28 days after the last reply. New replies are no longer allowed.

