hi all,
quite new in Kibana and need some help,
I'm trying to visualize a utilization of bots during a day\days (depended on filter @timestemp) ,
when a bot ended his run he log is total execution time in second, and he can run multiple times a day.
cant find a way to visualize a each bot utilization ratio to day ,
example:
y-axis : 0 - 100 % ( seconds in a day)
x-axis : @timestemp (each day)
split : sum(total execution time in second) of each robot
Hi @yonaten08. This very much depends on how your data is structured. I assume that each document represents one run of one bot. If so, it's pretty easy to set this chart up using Lens.
X axis I would use date histogram on the @timestamp field with the minimum interval set to 1 day
Y Axis I would use the Lens formula to sum(total execution time) / seconds in a day, and set the formatting to percent.
Split on robot id or any other unique identifier.
An extra step to make this nicer would be to use a reference line in Lens set to 100% to make sure that you are always in the range of 0-100%.
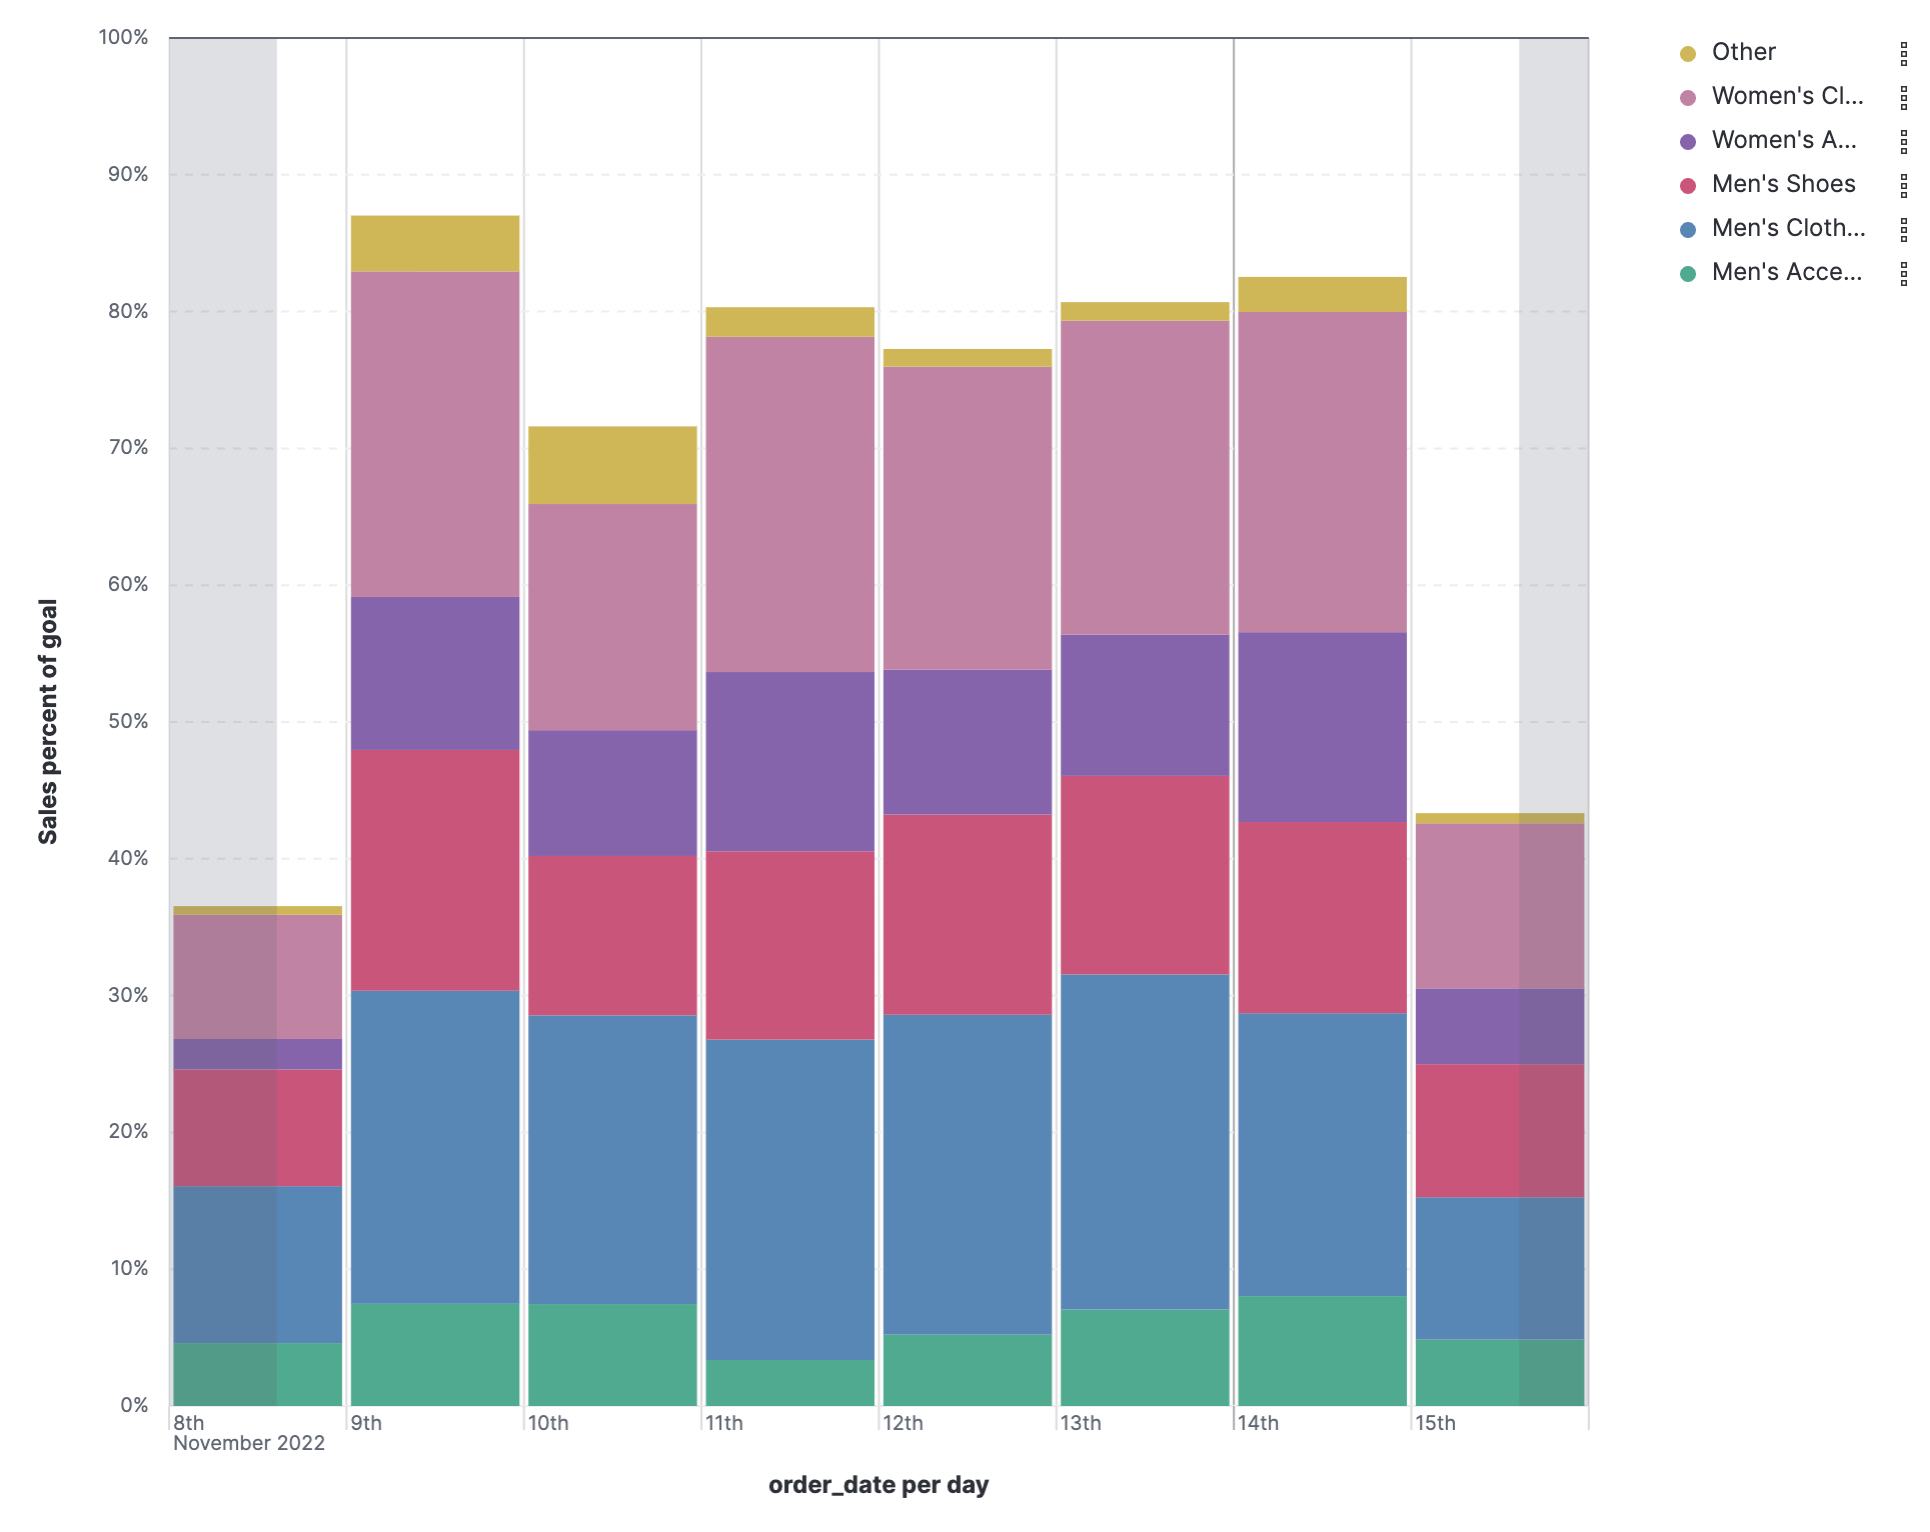
I know this isn't quite the same as your data, but here's an example of how it could look using our demo data.
Apache, Apache Lucene, Apache Hadoop, Hadoop, HDFS and the yellow elephant
logo are trademarks of the
Apache Software Foundation
in the United States and/or other countries.