I'm trying to create a visualization that tells when an account is being attack with a distributed brute force kind of attack. IThe idea is to have (initially I tried with cloud tag but I ended up with data table), a place where I can see the account names of the users with failed logins with a count of 5 or more originating IPs.
For instance, if account_1 fails to login 10 times from the same IP, that would be irrelevant for this visualization and should not show. If account_2 fails to login 10 times but using 5 or more different IPs, that account name should appear in the visualization.
I do have logs parsed already which apply the tags and keywords:
oip.keyword: which contains the originating IP
account.keyword: which contains the account name of the user
authentication_failed: which is a tag applied to the logs registiring a failed auth attempt
I'll show you what I have now, although it is not working as expected.
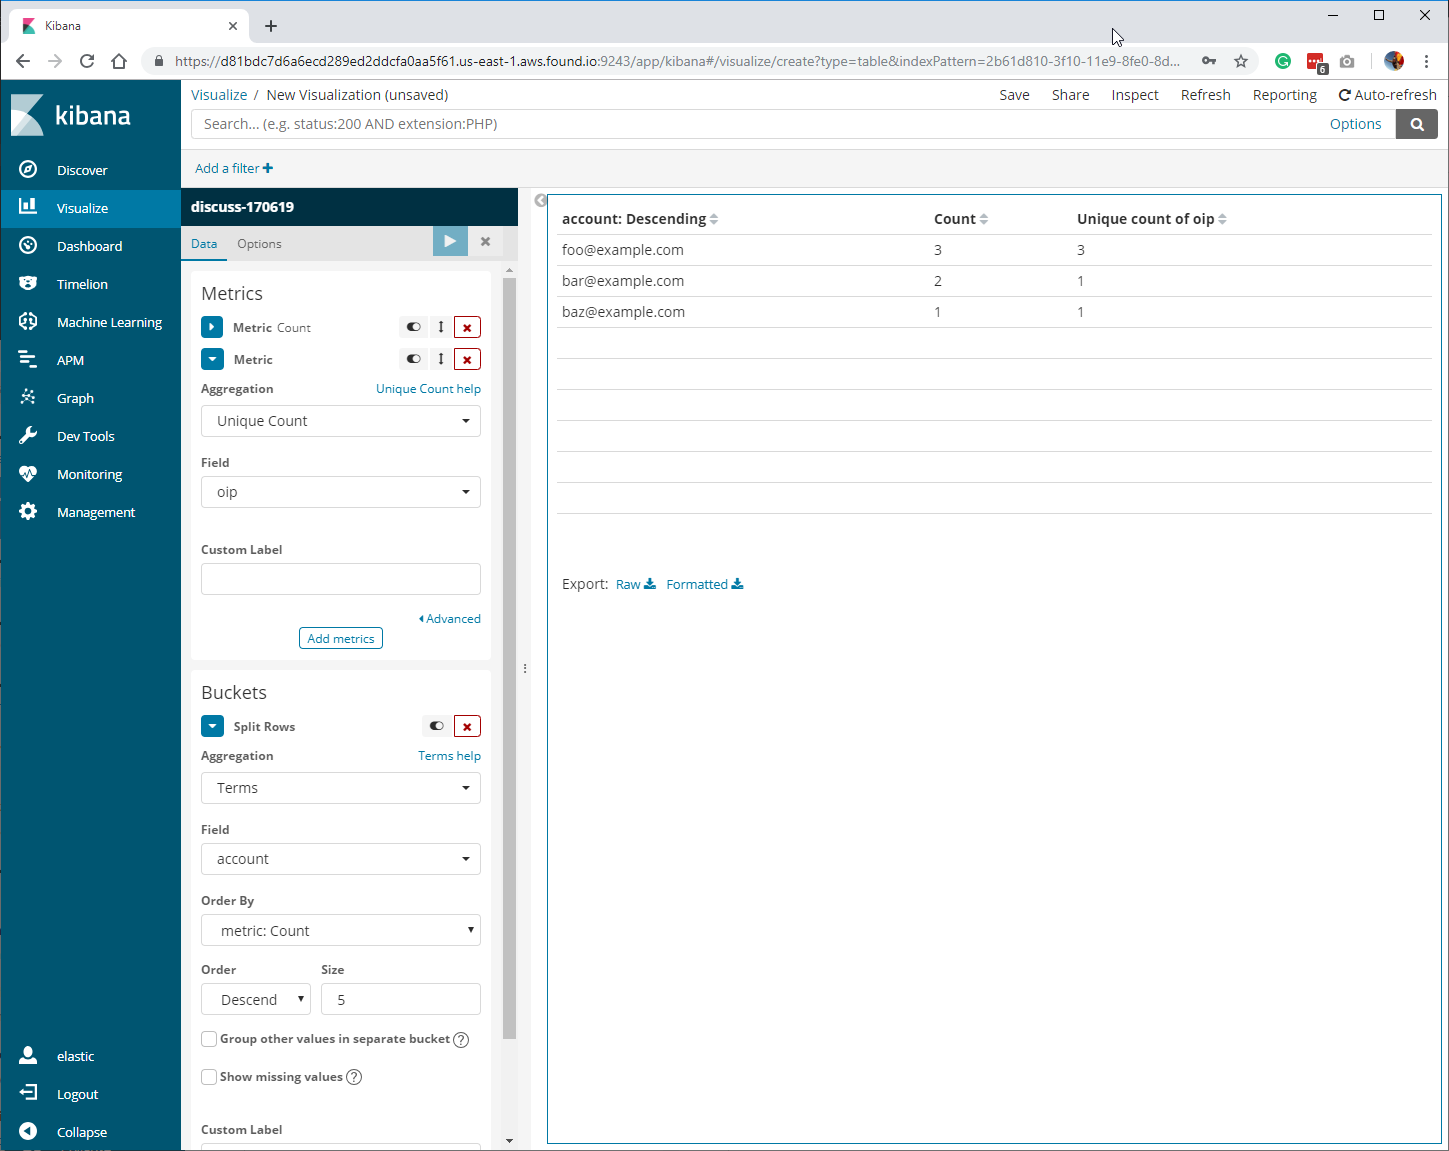
I created a search which uses this to find the relevant logs "tags: authentication_failed AND exists: oip"
I created a visualization of type "data table" based on the previous search.
The visualization looks like this right now.
This is the configuration I have right now.
In this example, I would only like to see "sebas@zimbra.cat" as is the only account with login attempts using different IPs (I'm using 3 as the limit of different IPs being used for ease of testing, as i dont have access to more IPs right now to test from ). The account "test1", also had some failed login attempts, but those should not be relevant as they are made from the same IP.
Could you please give me a tip or advice on how to accomplish this? I've been trying different things for 3-4 hours now but I'm not being able to achieve what i need.
As an aside, why would it be considered not an issue if the invalid attempts are from the same IP? I would think that brute force attacks are mostly from the same IP and are rarely distributed for the same account name.
Because when I tried splitting the metrics they did not look as cool as the ones from you example I'll try it again copying your conf, to see if I can do it like that Thank you!!!
why would it be considered not an issue if the invalid attempts are from the same IP
Good question. Thing is that it is considered an issue but already covered by other visualizations. I'll try to explain. This visualization will work with a Zimbra server. Zimbra, has 2 default protections: 1. Blocking an account after certain number of failed login attemps/time. 2. Blocking an IP after certain number of login attempts/time.
I already have the visualizations (both data tables) to see "account locked - count of failed login attempts" and "IPs suspended - count of failed login attemtps". The idea of this visualization is to get real time info about a distributed brute force attack happening during the day, but that are not triggering the other visualizations/zimbra protections.
I'm just discovering Elastic Stack and I'm really happy about it as it really is so nice to work with. This is my first contact with it and I hope I can have a nice final project to share https://github.com/Zimbra-Community/zimbra-elasticstack I know there are lots of things to improve in this git I'm sharing, things that hopefully I will get time to work after the 8 of this month. (like using conditionals in the grok filters, refining grok filters as I was learning them as I was writing them, creating specific zimbra paterns, adding a couple of visualizations more, parsing more zimbra events, multilines, etc).
Apache, Apache Lucene, Apache Hadoop, Hadoop, HDFS and the yellow elephant
logo are trademarks of the
Apache Software Foundation
in the United States and/or other countries.

 ). The account "test1", also had some failed login attempts, but those should not be relevant as they are made from the same IP.