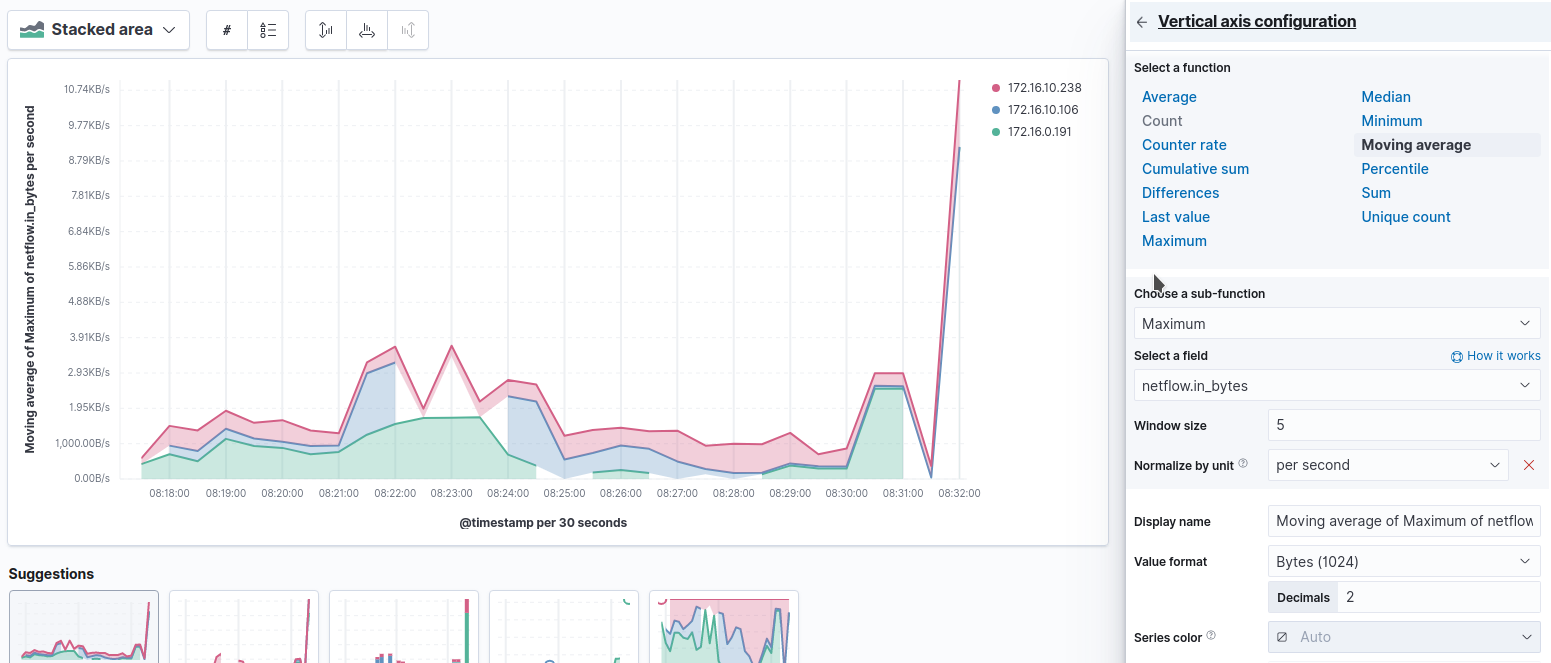
For my tests I started a "wget --limit-rate=200k xxx". My IP is 172.16.10.106.
Here is the vizualization I created. As you can see, the graph is wrong and I can't even see the download I'm doing.
You should be using TSVB as it will allow you to use pipeline aggregations and formulas, which are all necessary to achieve what you want.
Alternatively, just use ElastiFlow where all of this stuff has already been done for you. We use this where I work, and I use it for a home lab. The Basic License is free and should cover all of the data fields exported by OPNsense. The original ElastiFlow used Logstash, but the new version is a custom developed collector. It is much faster than Logstash or Filebeat, but it also has more netflow-specific features.
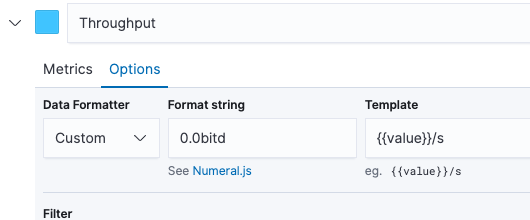
This is how ElastiFlow uses TSVB to turn the bytes value into a bandwdith value.
To display the value properly in bits/s, you would also add
When it comes to using Elastic for network data, the ElastiFlow team is the only people I have talked to which seem to know what they are talking about. They know the data, the use-cases and they know Elastic, maybe better than Elastic, definitely better than the solution architect we talked to.
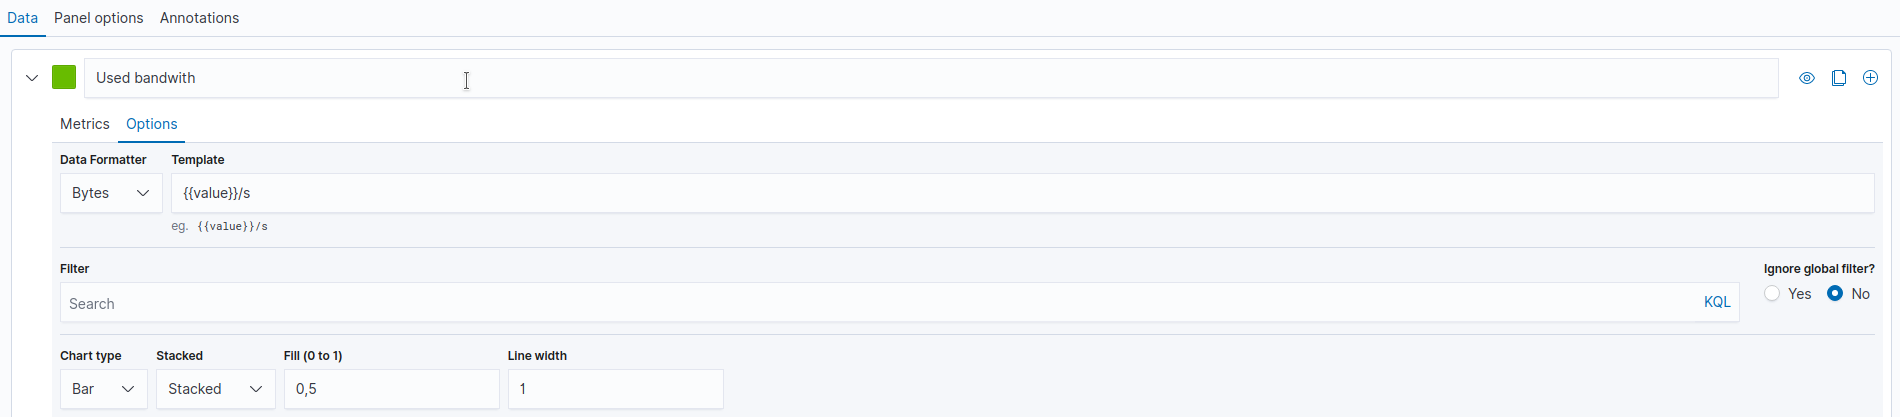
I spent a lot of time trying the same settings as you, but it's still not working... (I want the values to be in bytes, that's why the settings are not exactly the same).
We would like to avoid setting up another product like ElastiFlow.
Apache, Apache Lucene, Apache Hadoop, Hadoop, HDFS and the yellow elephant
logo are trademarks of the
Apache Software Foundation
in the United States and/or other countries.