Warm nodes on spinning disks not stable, falling out of cluster during recovery

yes, our next task ...

i'm aware of that, but our management is pushing us to deliver stable service, so first to green and stable response to searches. After that in evenings we'll start with fetch_shard_store threadpool to 1 and restart warm node by node with enabling replica one by one with pause between. Your thoughts ?

  "status" : "yellow",
  "timed_out" : false,
  "number_of_nodes" : 8,
  "number_of_data_nodes" : 8,
  "active_primary_shards" : 6874,
  "active_shards" : 8184,
  "relocating_shards" : 1,
  "initializing_shards" : 6,
  "unassigned_shards" : 163,
  "delayed_unassigned_shards" : 0,
  "number_of_pending_tasks" : 0,
  "number_of_in_flight_fetch" : 0,
  "task_max_waiting_in_queue_millis" : 0,
  "active_shards_percent_as_number" : 97.97677481144498

I would look to drop your shard count before restarting further.

is this right setting for elasticsearch.yml ?

thread_pool.fetch_shard_store.core: 1

warm nodes are still falling out of cluster:

[2020-09-30T16:30:32,098][DEBUG][o.e.c.a.s.ShardStateAction] [serverra2_warm.sit.comp.state] sending [internal:cluster/shard/started] to [BVnFEkNNTcKHn-WldV8mlw] for shard
 entry [StartedShardEntry{shardId [[comp_app_compp_rrs-performance-2020.08.08][0]], allocationId [NbGASq0BSamDAskL6z5sDA], primary term [41], message [after existing
store recovery; bootstrap_history_uuid=false]}]
[2020-09-30T16:30:33,499][DEBUG][o.e.c.a.s.ShardStateAction] [serverra2_warm.sit.comp.state] sending [internal:cluster/shard/started] to [BVnFEkNNTcKHn-WldV8mlw] for shard
 entry [StartedShardEntry{shardId [[comp_app_compp_srs-services-2020.08.08][0]], allocationId [8OAHKPBURQOMEBk6UldDvA], primary term [43], message [after existing sto
re recovery; bootstrap_history_uuid=false]}]
[2020-09-30T16:31:05,440][DEBUG][o.e.c.c.PublicationTransportHandler] [serverra2_warm.sit.comp.state] received diff cluster state version [459269] with uuid [oMZXGcEbQpmAV
mrJtiPJow], diff size [673]
[2020-09-30T16:31:21,251][DEBUG][o.e.c.a.s.ShardStateAction] [serverra2_warm.sit.comp.state] sending [internal:cluster/shard/started] to [BVnFEkNNTcKHn-WldV8mlw] for shard
 entry [StartedShardEntry{shardId [[comp_app_compp_rrs-daolog-2020.08.08][0]], allocationId [YROyRcorQyO2UXuCvG0VWQ], primary term [85], message [after existing store
 recovery; bootstrap_history_uuid=false]}]
[2020-09-30T16:33:05,868][DEBUG][o.e.c.c.PublicationTransportHandler] [serverra2_warm.sit.comp.state] received diff cluster state version [459270] with uuid [C6DRtdZmQaqaE
uxJMkjPfw], diff size [9155]
[2020-09-30T16:35:06,498][DEBUG][o.e.c.c.PublicationTransportHandler] [serverra2_warm.sit.comp.state] received diff cluster state version [459271] with uuid [3aF7wogRTM2A8
KyDb1rIyw], diff size [7192]
[2020-09-30T16:37:10,041][DEBUG][o.e.c.c.LeaderChecker    ] [serverra2_warm.sit.comp.state] 1 consecutive failures (limit [cluster.fault_detection.leader_check.retry_count
] is 9) with leader [{serverra3.sit.comp.state}{BVnFEkNNTcKHn-WldV8mlw}{0S9K9G-BRG2F_u2__tlZoA}{10.100.24.232}{10.100.24.232:9300}{dilmrt}{rack_id=rack_one, ml.machine_mem
ory=269645852672, ml.max_open_jobs=20, xpack.installed=true, data=hot, transform.node=true}]
org.elasticsearch.transport.RemoteTransportException: [serverra3.sit.comp.state][10.100.24.232:9300][internal:coordination/fault_detection/leader_check]
Caused by: org.elasticsearch.cluster.coordination.CoordinationStateRejectedException: rejecting leader check since [{serverra2_warm.sit.comp.state}{KiQQGwdoTgWwHYzMItyhXQ}
{-WbNLIpnR0i2_JR9srCxFQ}{10.100.24.231}{10.100.24.231:9301}{dlrt}{rack_id=rack_one, ml.machine_memory=269645852672, ml.max_open_jobs=20, xpack.installed=true, data=war
m, transform.node=true}] has been removed from the cluster
        at org.elasticsearch.cluster.coordination.LeaderChecker.handleLeaderCheck(LeaderChecker.java:180) ~[elasticsearch-7.7.0.jar:7.7.0]
        at org.elasticsearch.cluster.coordination.LeaderChecker.lambda$new$0(LeaderChecker.java:106) ~[elasticsearch-7.7.0.jar:7.7.0]
        at org.elasticsearch.xpack.security.transport.SecurityServerTransportInterceptor$ProfileSecuredRequestHandler$1.doRun(SecurityServerTransportInterceptor.java:2
57) ~[?:?]


...

[2020-09-30T16:37:16,063][DEBUG][o.e.c.c.LeaderChecker    ] [serverra2_warm.sit.comp.state] 3 consecutive failures (limit [cluster.fault_detection.leader_check.retry_count
] is 9) with leader [{serverra3.sit.comp.state}{BVnFEkNNTcKHn-WldV8mlw}{0S9K9G-BRG2F_u2__tlZoA}{10.100.24.232}{10.100.24.232:9300}{dilmrt}{rack_id=rack_one, ml.machine_mem
ory=269645852672, ml.max_open_jobs=20, xpack.installed=true, data=hot, transform.node=true}]
org.elasticsearch.transport.RemoteTransportException: [serverra3.sit.comp.state][10.100.24.232:9300][internal:coordination/fault_detection/leader_check]
Caused by: org.elasticsearch.cluster.coordination.CoordinationStateRejectedException: rejecting leader check since [{serverra2_warm.sit.comp.state}{KiQQGwdoTgWwHYzMItyhXQ}
{-WbNLIpnR0i2_JR9srCxFQ}{10.100.24.231}{10.100.24.231:9301}{dlrt}{rack_id=rack_one, ml.machine_memory=269645852672, ml.max_open_jobs=20, xpack.installed=true, data=war
m, transform.node=true}] has been removed from the cluster


...

[2020-09-30T16:37:34,121][INFO ][o.e.c.c.Coordinator      ] [serverra2_warm.sit.comp.state] master node [{serverra3.sit.comp.state}{BVnFEkNNTcKHn-WldV8mlw}{0S9K9G-BRG2F_u2__tl
ZoA}{10.100.24.232}{10.100.24.232:9300}{dilmrt}{rack_id=rack_one, ml.machine_memory=269645852672, ml.max_open_jobs=20, xpack.installed=true, data=hot, transform.node=t
rue}] failed, restarting discovery
org.elasticsearch.ElasticsearchException: node [{serverra3.sit.comp.state}{BVnFEkNNTcKHn-WldV8mlw}{0S9K9G-BRG2F_u2__tlZoA}{10.100.24.232}{10.100.24.232:9300}{dilmrt}{rack_
id=rack_one, ml.machine_memory=269645852672, ml.max_open_jobs=20, xpack.installed=true, data=hot, transform.node=true}] failed [9] consecutive checks

...

[2020-09-30T16:37:34,114][DEBUG][o.e.c.c.LeaderChecker    ] [serverra2_warm.sit.comp.state] leader [{serverra3.sit.comp.state}{BVnFEkNNTcKHn-WldV8mlw}{0S9K9G-BRG2F_u2__tlZoA}{
10.100.24.232}{10.100.24.232:9300}{dilmrt}{rack_id=rack_one, ml.machine_memory=269645852672, ml.max_open_jobs=20, xpack.installed=true, data=hot, transform.node=true}]
 has failed 9 consecutive checks (limit [cluster.fault_detection.leader_check.retry_count] is 9); last failure was:
org.elasticsearch.transport.RemoteTransportException: [serverra3.sit.comp.state][10.100.24.232:9300][internal:coordination/fault_detection/leader_check]
Caused by: org.elasticsearch.cluster.coordination.CoordinationStateRejectedException: rejecting leader check since [{serverra2_warm.sit.comp.state}{KiQQGwdoTgWwHYzMItyhXQ}
{-WbNLIpnR0i2_JR9srCxFQ}{10.100.24.231}{10.100.24.231:9301}{dlrt}{rack_id=rack_one, ml.machine_memory=269645852672, ml.max_open_jobs=20, xpack.installed=true, data=war
m, transform.node=true}] has been removed from the cluster

No, for scaling thread pools like fetch_shard_store the ....core setting is the minimum size of the thread pool. The setting you want is ....max.

thanks for correction, we're now in green and start adding replica to warm nodes.I'll get back to you on progress

Hi David,

so far so good. Not one warn/error (leader check, and ...) in warm node log (all 4 of them) after setting

thread_pool.fetch_shard_store.max: 1

We're adding replica to warm nodes at very high numbers (periodically increased):

"cluster.routing.allocation.node_concurrent_incoming_recoveries" : "13",
"cluster.routing.allocation.node_concurrent_outgoing_recoveries" : "13",
"cluster.routing.allocation.node_concurrent_recoveries" : "26",
"cluster.routing.allocation.node_initial_primaries_recoveries" : "8",
"indices.recovery.max_bytes_per_sec" : "700mb"

this is obviously ES issue that you noted. I'll let you know when it's over, we hope :slight_smile: . Thanks, you've been very helpful.

My advice above still stands: apart from indices.recovery.max_bytes_per_sec it is a bad idea to change any of these settings from the defaults.

Cluster is in green state and settings are now default. Hot nodes holds 26 TB, warm nodes 122 TB. All with 2 replica.

There was one more drop from cluster (only warm nodes) after update lots of indices from replica 1 to 2. Behavior was the same as with recovery, lots of disk wait. Can you give us suggestion for others thread pools max setting for warm nodes ?

Did those nodes drop from the cluster before or after you had restored the default values for the settings that you shouldn't have been changing?

During the period of high disk activity, what did the hot threads API report?

before default values.

I didn't catch the hot trades, i'll try the same update on tuesday , till then green and easy, let's stabilize.

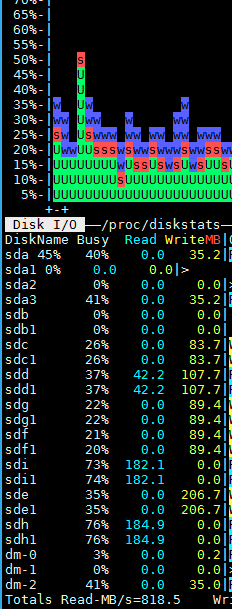
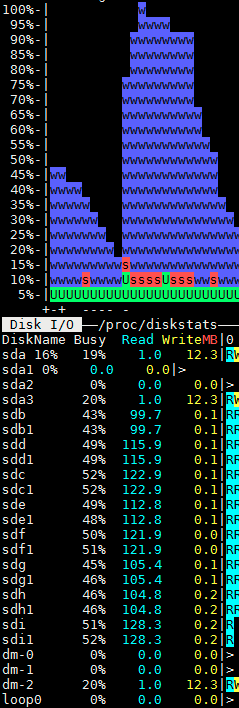
still in green but after restarting one warm node the same behavior with disks started (lots of reading and cpu wait, see picture below) and one more warm node drroped out from cluster. Now we are in yellow because lots of unassigned node-left warm node shards. Example:

"shard" : 0,
  "primary" : false,
  "current_state" : "unassigned",
  "unassigned_info" : {
    "reason" : "NODE_LEFT",
    "at" : "2020-10-06T19:55:04.100Z",
    "details" : "node_left [wz2VX0ZkQQivTfN3eAMzzA]",
    "last_allocation_status" : "no_attempt"
  },
  "can_allocate" : "awaiting_info",
  "allocate_explanation" : "cannot allocate because information about existing shard data is still being retrieved from some of the nodes",

i didn't catch hot threads because of query timeout

please advise should we lower any other threads pools for warm nodes ?

serverra3_warm.sit.comp.state analyze             0     0    0
serverra3_warm.sit.comp.state ccr                 0     0    0
serverra3_warm.sit.comp.state fetch_shard_started 0     0    0
serverra3_warm.sit.comp.state fetch_shard_store   1 10993    0
serverra3_warm.sit.comp.state flush               0     0    0
serverra3_warm.sit.comp.state force_merge         0     0    0
serverra3_warm.sit.comp.state generic             0     0    0
serverra3_warm.sit.comp.state get                 0     0    0
serverra3_warm.sit.comp.state listener            0     0    0
serverra3_warm.sit.comp.state management          1     0    0
serverra3_warm.sit.comp.state ml_datafeed         0     0    0
serverra3_warm.sit.comp.state ml_job_comms        0     0    0
serverra3_warm.sit.comp.state ml_utility          0     0    0
serverra3_warm.sit.comp.state refresh             0     0    0
serverra3_warm.sit.comp.state rollup_indexing     0     0    0
serverra3_warm.sit.comp.state search              0     0    0
serverra3_warm.sit.comp.state search_tstateottled    0     0    0
serverra3_warm.sit.comp.state security-token-key  0     0    0
serverra3_warm.sit.comp.state snapshot            0     0    0
serverra3_warm.sit.comp.state transform_indexing  0     0    0
serverra3_warm.sit.comp.state warmer              0     0    0
serverra3_warm.sit.comp.state watcher             0     0    0
serverra3_warm.sit.comp.state write               0     0    00

No, it looks like there's just a single thread reading from disk now, and obviously that's the minimum. I think there's something wrong with your disk config if your disks stop responding to writes so badly under single-threaded read load. Read traffic simply shouldn't block writes for tens of seconds like that.

Moving to a newer version would likely help a bit since there's less IO on the critical path for cluster state updates in 7.6+, but it doesn't reduce the IO to zero so I'd still recommend looking hard at your disk config too.

(I should add that all this is in addition to the main problem that you still have far too many shards for your own good)

my mistake, i left core=1 instead of max=1 on that falling warm node. Now we are back in green and we'll do the test again.

oversharding is our big issue, we are working od that. Since our input is mainly logs from lots of app servers (time based) we are thinkig of moving to new version with data streams, maybe this will ease our problems with oversharding, your opinion ?

and yes, this core=1was problem on one warm node. Now restart of warm nodes are fine, no more dropouts. We also had problem with hot nodes (on restarts), to many threads and ssd disks were to busy, cluster was unreachable for 5-10 min, so we put:

thread_pool.fetch_shard_store.max: 10

and everything is ok from then. Oversharding is our big problem so this is next on line.

thanks very much

1 Like

This topic was automatically closed 28 days after the last reply. New replies are no longer allowed.