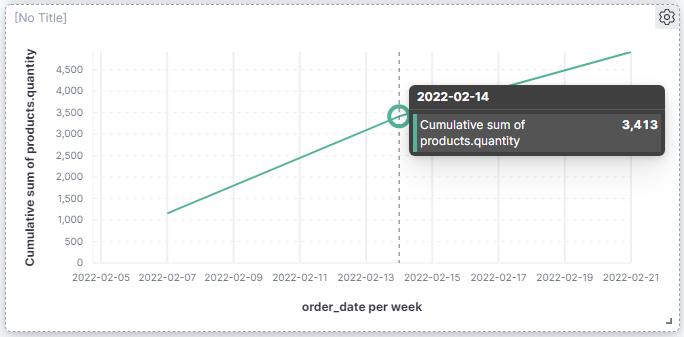
I noticed that weekly chart (pic3) is use “First day of week” as date label and “End day of week” as data value.
May I know is there any way that I can change the date label as “End day of week” in weekly chart (i.e. 20th Feb =3413 )
or make the weekly chart use “First day of week” as data value (i.e. 14th Feb =1450 )
pic1. cumulative sum of products.quantity per day in 14th Feb
Hi, I am not sure I fully understand your question. Are you saying there is a discrepancy between the data that should be shown and the data that is shown?
If you're just wondering how to change the first day of the week, you can do that from Advanced Settings > General and there you can specify if you want it to be Sunday, Monday or something else.
Since the cumulative sum of products.quantity on 2022-2-14 should be 1450(pic1 daily chart) and cumulative sum of products.quantity on 2022-2-20 should be 3413(pic2 daily chart).
When I change the x-axis to order_date per week(pic3), the tooltip show cumulative sum of products.quantity=3413 on 2022-2-14 should be on 2022-2-20
I would like to make weekly chart tooltip show either
products.quantity=3413 on 2022-2-20 (end on friday) (perferred) OR
products.quantity=1450 on 2022-2-14 (start on monday)
Apache, Apache Lucene, Apache Hadoop, Hadoop, HDFS and the yellow elephant
logo are trademarks of the
Apache Software Foundation
in the United States and/or other countries.