I've recently migrated a medium sized cluster (15TB, 25B documents) from 6.8 to 7.8.0 and noticed the heap constantly fluctuates between <1GB and the maximum set size (22GB). However the cluster is working perfectly fine and is noticeably faster after the upgrade, so I decided to let it go for the moment.
Yesterday I had to start a new single-server cluster with only a few indices with about 1000 documents each. It's practically empty. Indexing and searching are rare too (few events/minute), but I noticed the same pattern here too. Again, everything is stable and works fast.
The VM has 16G RAM and ES is given 8GB (-Xms8g and -Xmx8g).
Here's how the graphs look like (1 hour period):
I do not think this is an issue as it is the shape of a generally healthy heap usage. Given the amount of data you state the cluster holds the periodicity is low, but I guess that might be explained by your rather extreme settings (http.max_content_length: 1024mb and indices.query.bool.max_clause_count: 50000), which are likely to cause a lot of heap usage.
Thanks. I have commented out those two settings as they are not relevant for this cluster anyway (copied them from an old one). After a few hours I don't see any difference in the heap usage.
It doesn't look quite normal to me if a memory is constantly being filled and emptied. I've been using ES since 1.x, went through all updates and this first appeared when I upgraded from 6.8 to 7.8. Here are some graphs at the time of the upgrade of my main cluster (but the issue is clearly visible even on my most basic clusters).
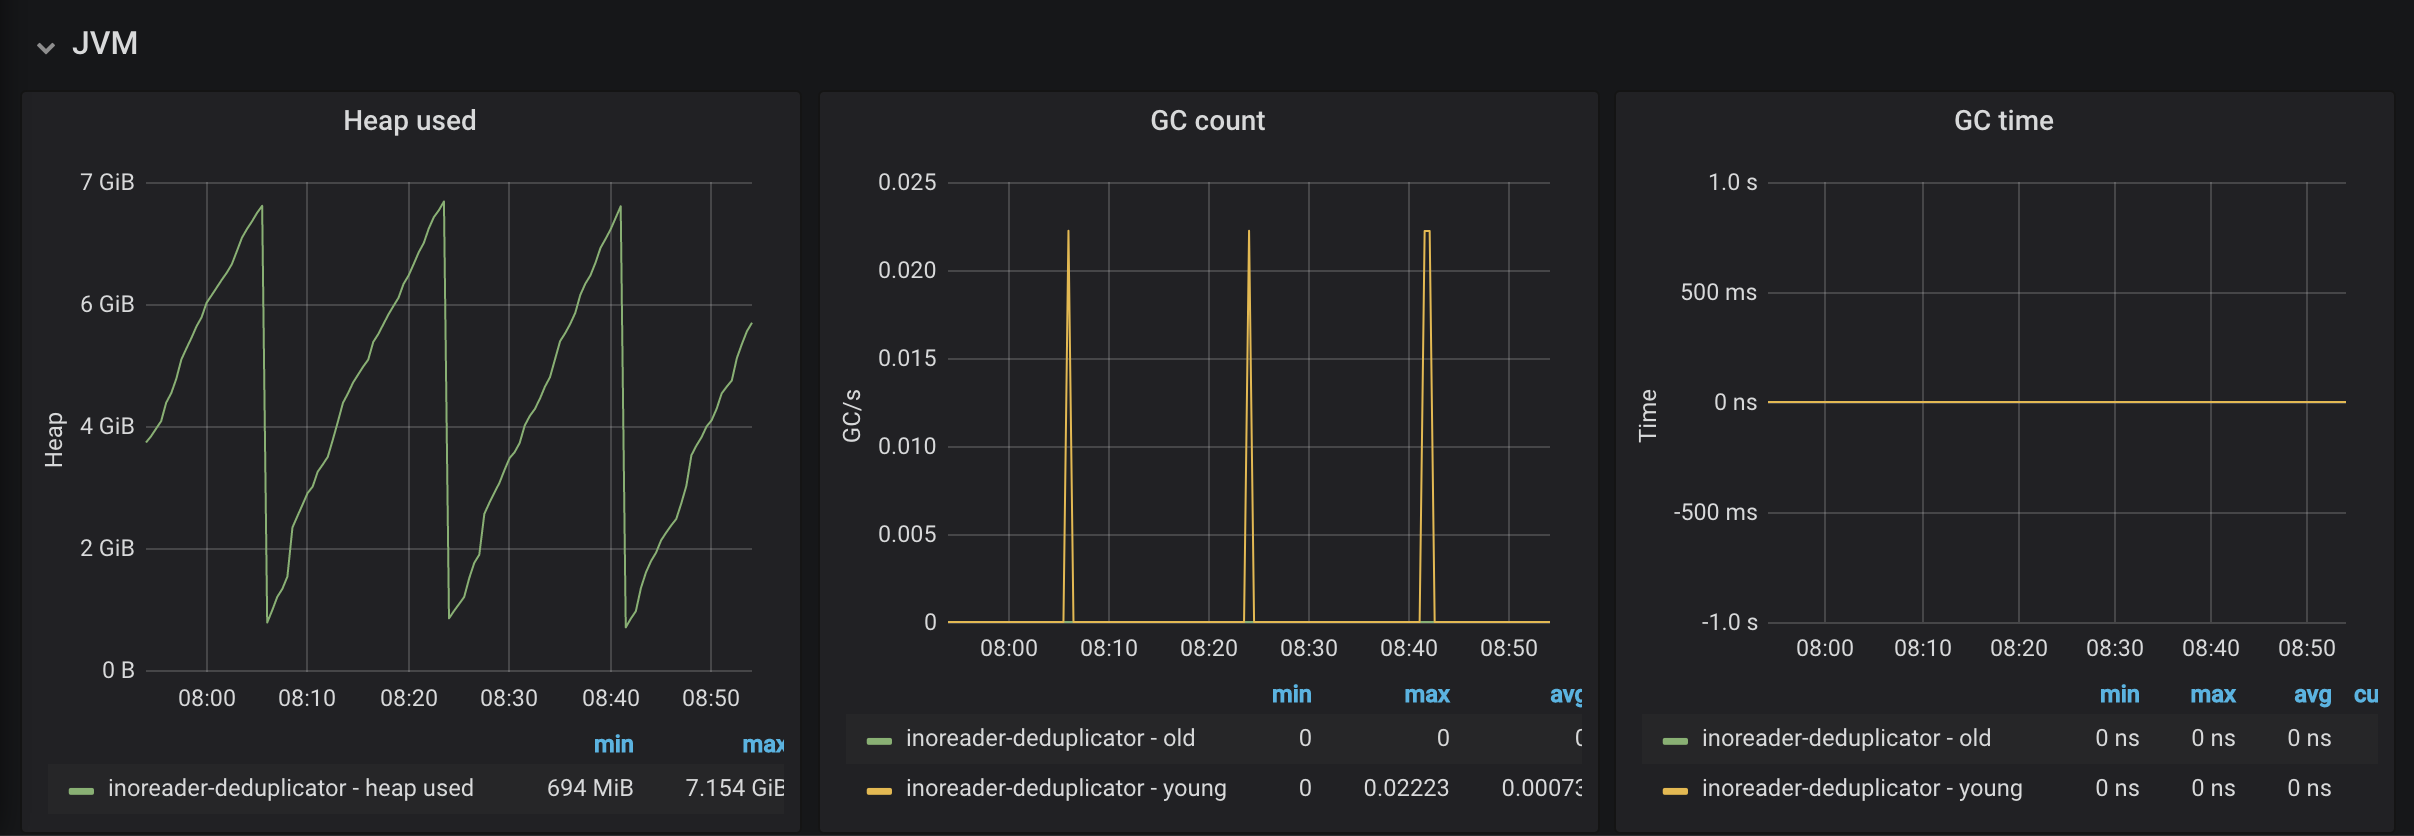
At this point -Xms and -Xmx we around the 30GB mark (always making sure compressed pointers are enabled, servers have 64G memory). I've since lowered it to 8GB as it seems I don't need that much heap even with more than 2TB of data per server, but still looks very unstable. This is graph is just for one hour:
I'll say it again, all clusters work perfectly fine, no crashes, 7.8 is even quite faster than 6.8 in my case, especially when I lowered the heap size to 8G (probably more memory left for OS caches), but looking at graphs like this always makes me uneasy that something is wrong.
Thanks for the replies. I'll ignore this for now then, because my clusters are really working flawlessly. @Kim-Kruse-Hansen I don't think I've changed the jvm.options defaults:
## GC configuration
8-13:-XX:+UseConcMarkSweepGC
8-13:-XX:CMSInitiatingOccupancyFraction=75
8-13:-XX:+UseCMSInitiatingOccupancyOnly

## G1GC Configuration
# NOTE: G1 GC is only supported on JDK version 10 or later
# to use G1GC, uncomment the next two lines and update the version on the
# following three lines to your version of the JDK
# 10-13:-XX:-UseConcMarkSweepGC
# 10-13:-XX:-UseCMSInitiatingOccupancyOnly
14-:-XX:+UseG1GC
14-:-XX:G1ReservePercent=25
14-:-XX:InitiatingHeapOccupancyPercent=30
Apache, Apache Lucene, Apache Hadoop, Hadoop, HDFS and the yellow elephant
logo are trademarks of the
Apache Software Foundation
in the United States and/or other countries.