 "sort" : [
    	{ "@timestamp" : {"order" : "asc"}}
    	]
When i use timestamp to sort data in order,if 2 datas have the same timestamp i'm not able to get the data in logstash processed order.plz help
"sort" : [
{ "@timestamp" : {"order" : "asc"}}
]
When i use timestamp to sort data in order,if 2 datas have the same timestamp i'm not able to get the data in logstash processed order.plz help
If you are reading the data using Filebeat, there is an offset parameter provided that describes the position within the file. You should be able to use this as a secondary sorting key to get the correct order.
I'm not using Filebeat . Is there any other possibility??
The Logstash file input does not record this, and there is an issue around it that has been open a long time. I would recommend using Filebeat, as this now is the recommended way to read files.
I'll give it a try. Is there a way we can add unique id's along with grok pattern
I do not understand how this relates to the sorting. If it is not related to the sorting and you just want to prevent duplicates, read this blog post.
My Concern is not regarding duplicate values.I just want the data from elastic search to
be in the same order as it is in the log file
For that you need the offset unless there is some kind of sequence or line number in the log file you can extract and use.
Thank you very much
How to use multiline codec along with beats plugin, its showing an error "Multiline codec with beats input is not supported"?
One more problem is that when i try setting 2 outputs in filebeats.yml file i'm getting an error message "more than one namespace configured accessing 'output' "
Filebeat has support for multiline processing, and you should always perform multiline processing as close to the source as possible.
How to fix this?
As far as I know Filebeat only supports a single output. Why do you need more than one?
I'm using logstash and elasticsearch .
Why not send all the data through Logstash?
I'm using elasticsearch to query the data
What does that have to do with the Filebeat config?
If you configure Filebeat to send all data to Logstash, which will in turn write it to Elasticsearch once it has been processed, you will have the offset field provided when you query your data in Elasticsearch.
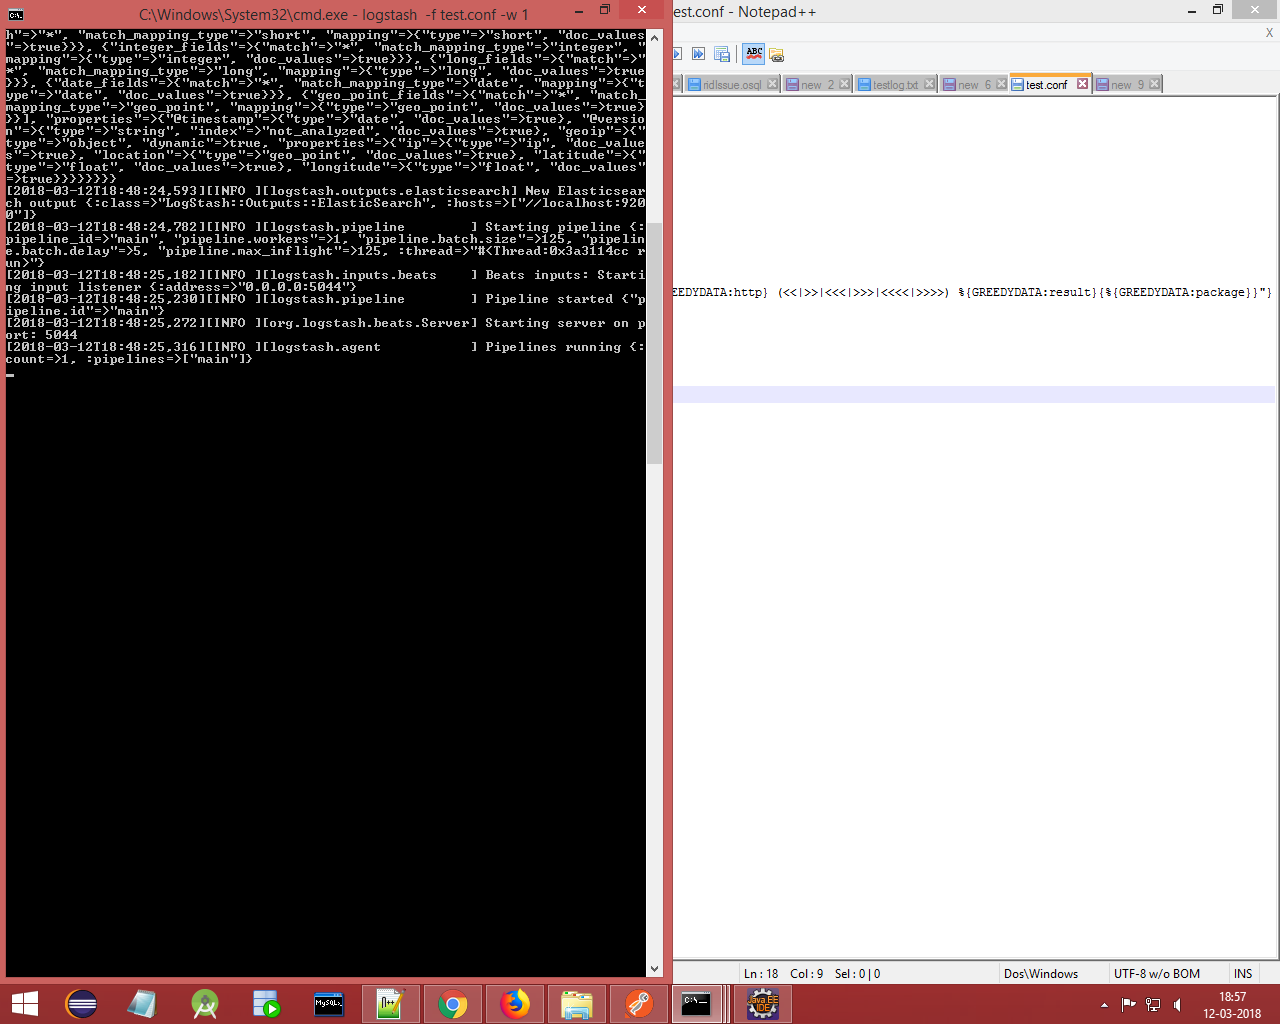
Have you configured Filebeat to actually process any logs so there is data to send to Logstash? Also please do not post screenshots or images of text when you can copy and paste. Images can be hard to read and are not searchable.
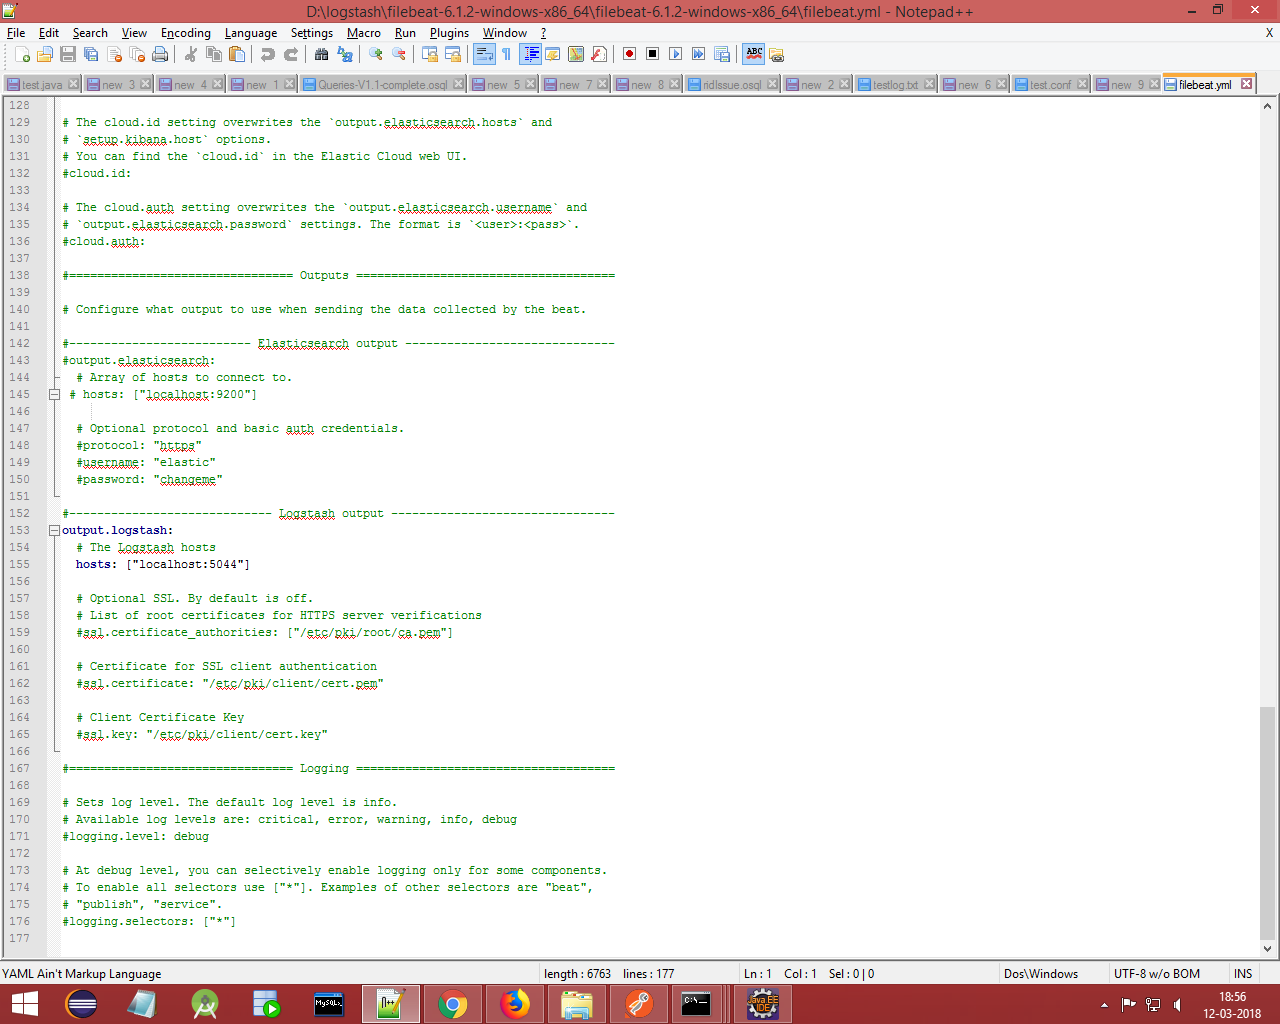
###################### Filebeat Configuration Example #########################
# This file is an example configuration file highlighting only the most common
# options. The filebeat.reference.yml file from the same directory contains all the
# supported options with more comments. You can use it as a reference.
#
# You can find the full configuration reference here:
# https://www.elastic.co/guide/en/beats/filebeat/index.html
# For more available modules and options, please see the filebeat.reference.yml sample
# configuration file.
#=========================== Filebeat prospectors =============================
filebeat.prospectors:
# Each - is a prospector. Most options can be set at the prospector level, so
# you can use different prospectors for various configurations.
# Below are the prospector specific configurations.
- type: log
_ # Change to true to enable this prospector configuration._
_ enabled: true_
_ # Paths that should be crawled and fetched. Glob based paths._
_ paths:_
_ - D:\logstash\logstash-6.1.0\bin\testlog.txt_
_ #- c:\programdata\elasticsearch\logs*_
_ # Exclude lines. A list of regular expressions to match. It drops the lines that are_
_ # matching any regular expression from the list._
_ #exclude_lines: ['^DBG']_
_ # Include lines. A list of regular expressions to match. It exports the lines that are_
_ # matching any regular expression from the list._
_ #include_lines: ['^ERR', '^WARN']_
_ # Exclude files. A list of regular expressions to match. Filebeat drops the files that_
_ # are matching any regular expression from the list. By default, no files are dropped._
_ #exclude_files: ['.gz$']_
_ # Optional additional fields. These fields can be freely picked_
_ # to add additional information to the crawled log files for filtering_
_ #fields:_
_ # level: debug_
_ # review: 1_
_ ### Multiline options_
_ # Mutiline can be used for log messages spanning multiple lines. This is common_
_ # for Java Stack Traces or C-Line Continuation_
_ # The regexp Pattern that has to be matched. The example pattern matches all lines starting with [_
_ multiline.pattern: [%{DATA}_
_ # Defines if the pattern set under pattern should be negated or not. Default is false._
_ multiline.negate: false_
_ # Match can be set to "after" or "before". It is used to define if lines should be append to a pattern_
_ # that was (not) matched before or after or as long as a pattern is not matched based on negate._
_ # Note: After is the equivalent to previous and before is the equivalent to to next in Logstash_
_ multiline.match: after_
#============================= Filebeat modules ===============================
filebeat.config.modules:
_ # Glob pattern for configuration loading_
_ path: ${path.config}/modules.d/*.yml_
_ # Set to true to enable config reloading_
_ reload.enabled: false_
_ # Period on which files under path should be checked for changes_
_ #reload.period: 10s_
#==================== Elasticsearch template setting ==========================
setup.template.settings:
_ index.number_of_shards: 3_
_ #index.codec: best_compression_
_ #source.enabled: false
#================================ General =====================================
# The name of the shipper that publishes the network data. It can be used to group
# all the transactions sent by a single shipper in the web interface.
#name:
# The tags of the shipper are included in their own field with each
# transaction published.
#tags: ["service-X", "web-tier"]
# Optional fields that you can specify to add additional information to the
# output.
#fields:
# env: staging
#============================== Dashboards =====================================
# These settings control loading the sample dashboards to the Kibana index. Loading
# the dashboards is disabled by default and can be enabled either by setting the
# options here, or by using the -setup CLI flag or the setup command.
#setup.dashboards.enabled: false
# The URL from where to download the dashboards archive. By default this URL
# has a value which is computed based on the Beat name and version. For released
# versions, this URL points to the dashboard archive on the artifacts.elastic.co
# website.
#setup.dashboards.url:
#============================== Kibana =====================================
# Starting with Beats version 6.0.0, the dashboards are loaded via the Kibana API.
# This requires a Kibana endpoint configuration.
setup.kibana:
_ # Kibana Host_
_ # Scheme and port can be left out and will be set to the default (http and 5601)_
_ # In case you specify and additional path, the scheme is required: http://localhost:5601/path_
_ # IPv6 addresses should always be defined as: https://[2001:db8::1]:5601_
_ #host: "localhost:5601"_
#============================= Elastic Cloud ==================================
# These settings simplify using filebeat with the Elastic Cloud (https://cloud.elastic.co/).
# The cloud.id setting overwrites the output.elasticsearch.hosts and
# setup.kibana.host options.
# You can find the cloud.id in the Elastic Cloud web UI.
#cloud.id:
# The cloud.auth setting overwrites the output.elasticsearch.username and
# output.elasticsearch.password settings. The format is <user>:<pass>.
#cloud.auth:
#================================ Outputs =====================================
# Configure what output to use when sending the data collected by the beat.
#-------------------------- Elasticsearch output ------------------------------
#output.elasticsearch:
_ # Array of hosts to connect to._
_ # hosts: ["localhost:9200"]_
_ # Optional protocol and basic auth credentials._
_ #protocol: "https"_
_ #username: "elastic"_
_ #password: "changeme"_
#----------------------------- Logstash output --------------------------------
output.logstash:
_ # The Logstash hosts_
_ hosts: ["localhost:5044"]_
_ # Optional SSL. By default is off._
_ # List of root certificates for HTTPS server verifications_
_ #ssl.certificate_authorities: ["/etc/pki/root/ca.pem"]_
_ # Certificate for SSL client authentication_
_ #ssl.certificate: "/etc/pki/client/cert.pem"_
_ # Client Certificate Key_
_ #ssl.key: "/etc/pki/client/cert.key"_
#================================ Logging =====================================
# Sets log level. The default log level is info.
# Available log levels are: critical, error, warning, info, debug
#logging.level: debug
# At debug level, you can selectively enable logging only for some components.
# To enable all selectors use ["*"]. Examples of other selectors are "beat",
# "publish", "service".
#logging.selectors: ["*"]
I think i've configured it correctly and the problem might be with sinceDB because i saw the response once
© 2020. All Rights Reserved - Elasticsearch
Apache, Apache Lucene, Apache Hadoop, Hadoop, HDFS and the yellow elephant logo are trademarks of the Apache Software Foundation in the United States and/or other countries.