I am updating the logstash.conf file as the communication protocol changes in my system from Lumberjack to HTTPS.
With Lumberjack, one of the log items called "host" is formatted as:
"host": {
"name": "some_host_name"
},
On the other hand, With HTTPS it is formatted as:
"host": "some_host_name"
So I reformatted the latter into former using the following mutate command as suggested at How to add nested log data or replace string values with nested log data on logstash.conf?.
if "name" not in [host] {
mutate { rename => { "[host]" => "[@metadata][host]" } }
mutate { add_field => { "[host][name]" => "%{[@metadata][host]}" } }
}
}
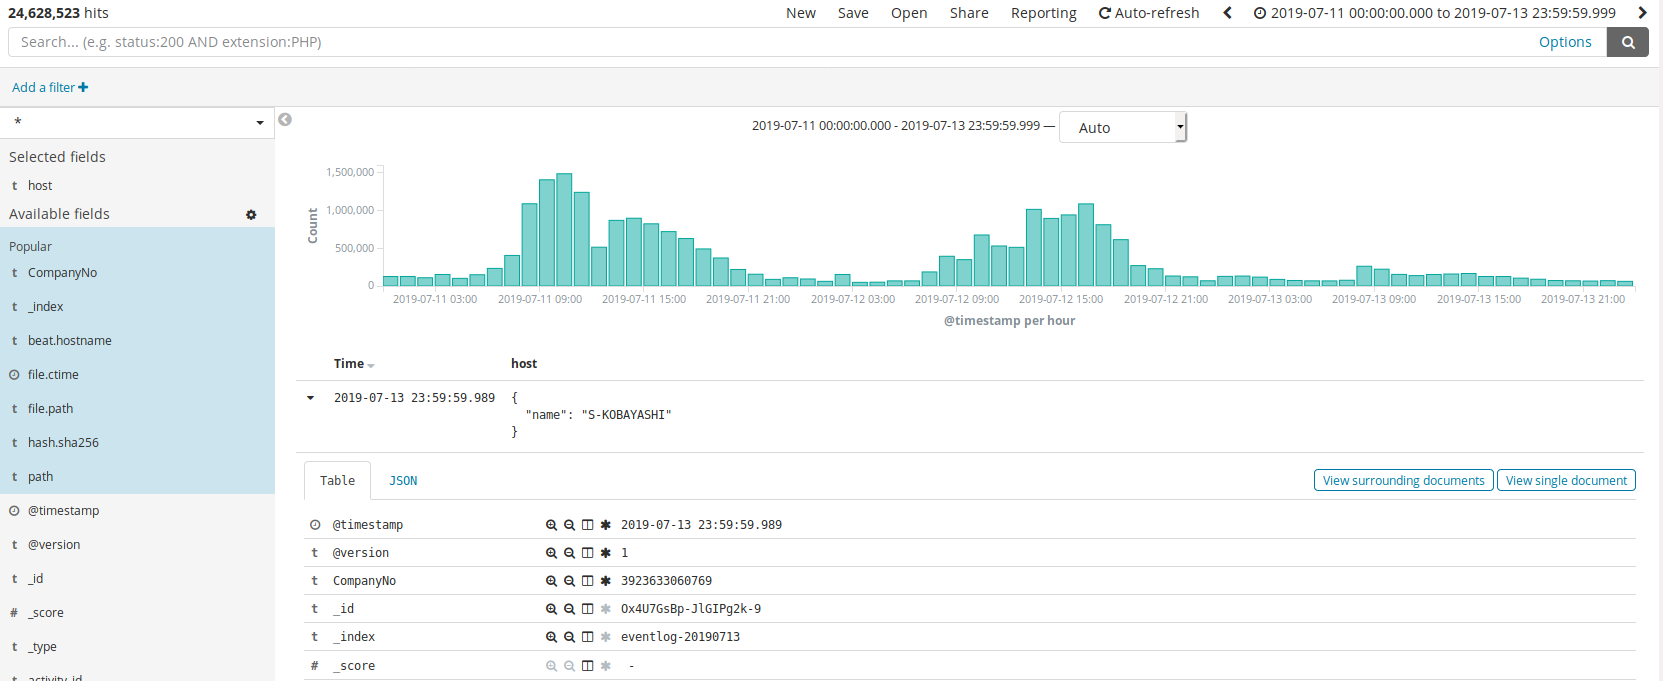
This command successfully modified the log data and inserted into Elasticsearch. However, Kibana displays the data in a different way somehow (see the element of "host" and "host.name"). As the "_id" shows, these are exactly same log data. The only difference is that the ranger of filtering on Kibana (eventlog-* and -). I am guessing, when filtering by eventlog-, no data inserted by HTTPS (and its reformatting) would included in the search result, and when filtering by -*, some of them would be included, but I do not know what internal mechanism makes such difference even thought JSON data is totally same.


I do not think this difference would make any trouble due to the format gap cus it is same in json, but could you tell me why/how this happens, and if there is, any potential error for this discrepancy on CRUD data manipulation?