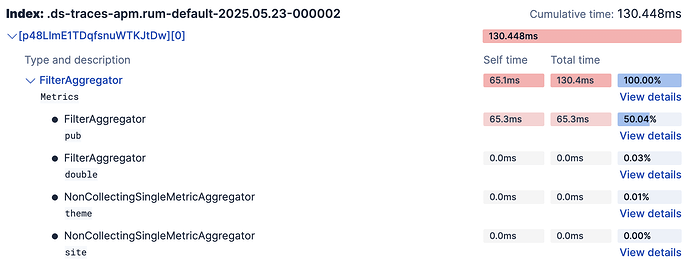
I have queries with aggregation, the query section is the same for both, but the aggregation section is a little different and I don't understand why the different results are coming.
agg1:
{
    "aggs": {
        "Metrics": {
            "filter": {
                "match_all": {}
            },
            "aggs": {
                "double": {
                    "filter": {
                        "term": {
                            "is_double": true
                        }
                    }
                },
                "pub": {
                    "filter": {
                        "match_all": {}
                    }
                },
                "theme": {
                    "cardinality": {
                        "field": "tfidf_parent_id"
                    }
                },
                "site": {
                    "cardinality": {
                        "field": "site_id"
                    }
                }
            }
        }
    }
}
agg2:
{
    "aggs": {
        "date": {
            "date_histogram": {
                "field": "created",
                "interval": "hour",
                "format": "yyyy-MM-dd HH:mm:ss.SSSSSS",
                "extended_bounds": {
                    "min": "2025-05-22 00:00:00.000000",
                    "max": "2025-05-22 23:59:59.999000"
                }
            },
            "aggs": {
                "Metrics": {
                    "filter": {
                        "match_all": {}
                    },
                    "aggs": {
                        "double": {
                            "filter": {
                                "term": {
                                    "is_double": true
                                }
                            }
                        },
                        "pub": {
                            "filter": {
                                "match_all": {}
                            }
                        },
                        "theme": {
                            "cardinality": {
                                "field": "tfidf_parent_id"
                            }
                        },
                        "site": {
                            "cardinality": {
                                "field": "site_id"
                            }
                        }
                    }
                }
            }
        }
    }
}
in query section this have equal time range, but aggregation result is different. For first case is 912 for next is 948, its a sum of "site" bucket


