I am not sure why Kibana shoes incomplete message field when logstash shoes full message on the termincal at STDOUT?
Any setting i need to change ?
I am not sure why Kibana shoes incomplete message field when logstash shoes full message on the termincal at STDOUT?
Any setting i need to change ?
Sorry @shroh, but I'm going to need more information in order to help. Can you provide the logstash config you are using, as well as screenshots of STDOUT and Kibana with the behavior you described?
Sorry about the incomplete info:
Here is the logstash config
input {

     beats {
      port => 9997
     }
}
filter {
      if [fields][source] == "monic_tomcat_perf" {

         grok {
            match => {"message" => "%{MONTHDAY} %{MONTH} %{YEAR} %{TIME},%{NUMBER:duration} %{WORD:loglevel}  %{WORD:Activity}   \[\{%{DATA:foo1}\}\]:(.*) execution time: %{NUMBER:executionTime:float} ms"}
            }
         kv   {
              source => "foo1"
              field_split => ", "
             }
         mutate {
           remove_field => [ "foo1" ]
            }
      }
        else if [fields][source] == "monic_web_log" {
         grok {
            match => {"message" => "(%{COMMONAPACHELOG})? Client-Correlation-Id=%{NOTSPACE:id} ResponseSecs=%{NUMBER:responsesecs} ResponseMicros=%{NUMBER:responseMicros} (\"%{URI:url}\")? %{GREEDYDATA:device}"}
            }

      }

        else if [fields][source] == "monic_tomcat_app" {
         grok {
            match => {"message" => "%{MONTHDAY} %{MONTH} %{YEAR} %{TIME},%{NUMBER:duration} %{WORD:loglevel}%{SPACE}%{WORD:Activity} \[\{(%{DATA:foo1})?\}\]: %{GREEDYDATA:foo2} User=\"Associate\(%{DATA:foo3}\)\""}

                }
         kv   {
              source => "foo1"
              field_split => ", "
            }
         kv   {
              source => "foo2"
              field_split => " "
            }

         kv   {
              source => "foo3"
              field_split => ", "
            }
     }
}
output {
elasticsearch {
                hosts => "localhost:9200"
                #manage_template => false
                index => harmonic_dev
                user => elastic
                password => elasticpassword
          }
  stdout { codec => rubydebug}
}
This the log file line that i injested for reproducing this issue, the output which i see in Kibana is truncated. In the screenshot i am attaching, the first event i am talking about with latest time stamp.
[%t] 08 Aug 2017 18:55:38,203 INFO HomeBaseApiConsumer [{applicationSystemCode=monicapp-app, clientIP=10.218.87.153, clusterId=Cluster-Id-NA, containerId=Container-Id-NA, correlationId=205c2806-2f97-f42f-00f5-9a43aafb9eb3, domainName=defaultDomain, hostName=ip-202-100-x.domain.com, messageId=10.202.100.34-4041d41d-75f3-4282-9aab-dd1ab17ecdf3, userId=ANONYMOUS, webAnalyticsCorrelationId=B347BC083EB9DCE4ED5005506F1F1E63|}]: KpiMetric="Cta" TransactionName="ApplicationDetail" TransactionStatus="Success" User="Associate(firstName=mike, lastName=henry, role=Consultant, email=mike@domain.com, electronicId=M422)".
Also i dont see the fields being parsed by logstash, it should have invoked the condition else if [source][fields] = "monic_tomcat_app"
Not sure if my conditional statements are wrong. But two summarise the issues
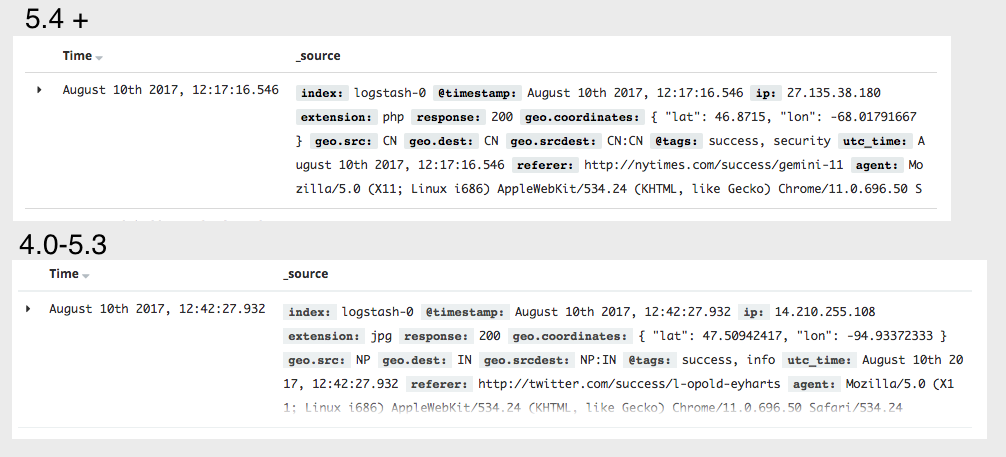
Oh, are you wondering why this message is truncated?

Looks like in 5.4 the style applied to rows that are truncated in discover was changed to get rid of the gradient that use to signal that there was more to what is being presented:
I'm checking with the team, not sure if this is intended or now, but if you open that row you should be able to see the whole message
i figured it out , i changed the setting in Kibana and can now see the whole message.
© 2020. All Rights Reserved - Elasticsearch
Apache, Apache Lucene, Apache Hadoop, Hadoop, HDFS and the yellow elephant logo are trademarks of the Apache Software Foundation in the United States and/or other countries.