Thanks for the notice, I did change the password right away.
Is packetbeat and elastic both on versions
yes - both are 8.3.3
What does this return GET _ingest/pipeline/geoip-info ?
{
  "geoip-info": {
    "description": "Add geoip info",
    "processors": [
      {
        "geoip": {
          "field": "client.ip",
          "target_field": "client.geo",
          "ignore_missing": true
        }
      },
      {
        "geoip": {
          "database_file": "GeoLite2-ASN.mmdb",
          "field": "client.ip",
          "target_field": "client.as",
          "properties": [
            "asn",
            "organization_name"
          ],
          "ignore_missing": true
        }
      },
      {
        "geoip": {
          "field": "source.ip",
          "target_field": "source.geo",
          "ignore_missing": true
        }
      },
      {
        "geoip": {
          "database_file": "GeoLite2-ASN.mmdb",
          "field": "source.ip",
          "target_field": "source.as",
          "properties": [
            "asn",
            "organization_name"
          ],
          "ignore_missing": true
        }
      },
      {
        "geoip": {
          "field": "destination.ip",
          "target_field": "destination.geo",
          "ignore_missing": true
        }
      },
      {
        "geoip": {
          "database_file": "GeoLite2-ASN.mmdb",
          "field": "destination.ip",
          "target_field": "destination.as",
          "properties": [
            "asn",
            "organization_name"
          ],
          "ignore_missing": true
        }
      },
      {
        "geoip": {
          "field": "server.ip",
          "target_field": "server.geo",
          "ignore_missing": true
        }
      },
      {
        "geoip": {
          "database_file": "GeoLite2-ASN.mmdb",
          "field": "server.ip",
          "target_field": "server.as",
          "properties": [
            "asn",
            "organization_name"
          ],
          "ignore_missing": true
        }
      },
      {
        "geoip": {
          "field": "host.ip",
          "target_field": "host.geo",
          "ignore_missing": true
        }
      },
      {
        "rename": {
          "field": "server.as.asn",
          "target_field": "server.as.number",
          "ignore_missing": true
        }
      },
      {
        "rename": {
          "field": "server.as.organization_name",
          "target_field": "server.as.organization.name",
          "ignore_missing": true
        }
      },
      {
        "rename": {
          "field": "client.as.asn",
          "target_field": "client.as.number",
          "ignore_missing": true
        }
      },
      {
        "rename": {
          "field": "client.as.organization_name",
          "target_field": "client.as.organization.name",
          "ignore_missing": true
        }
      },
      {
        "rename": {
          "field": "source.as.asn",
          "target_field": "source.as.number",
          "ignore_missing": true
        }
      },
      {
        "rename": {
          "field": "source.as.organization_name",
          "target_field": "source.as.organization.name",
          "ignore_missing": true
        }
      },
      {
        "rename": {
          "field": "destination.as.asn",
          "target_field": "destination.as.number",
          "ignore_missing": true
        }
      },
      {
        "rename": {
          "field": "destination.as.organization_name",
          "target_field": "destination.as.organization.name",
          "ignore_missing": true
        }
      }
    ]
  }
}
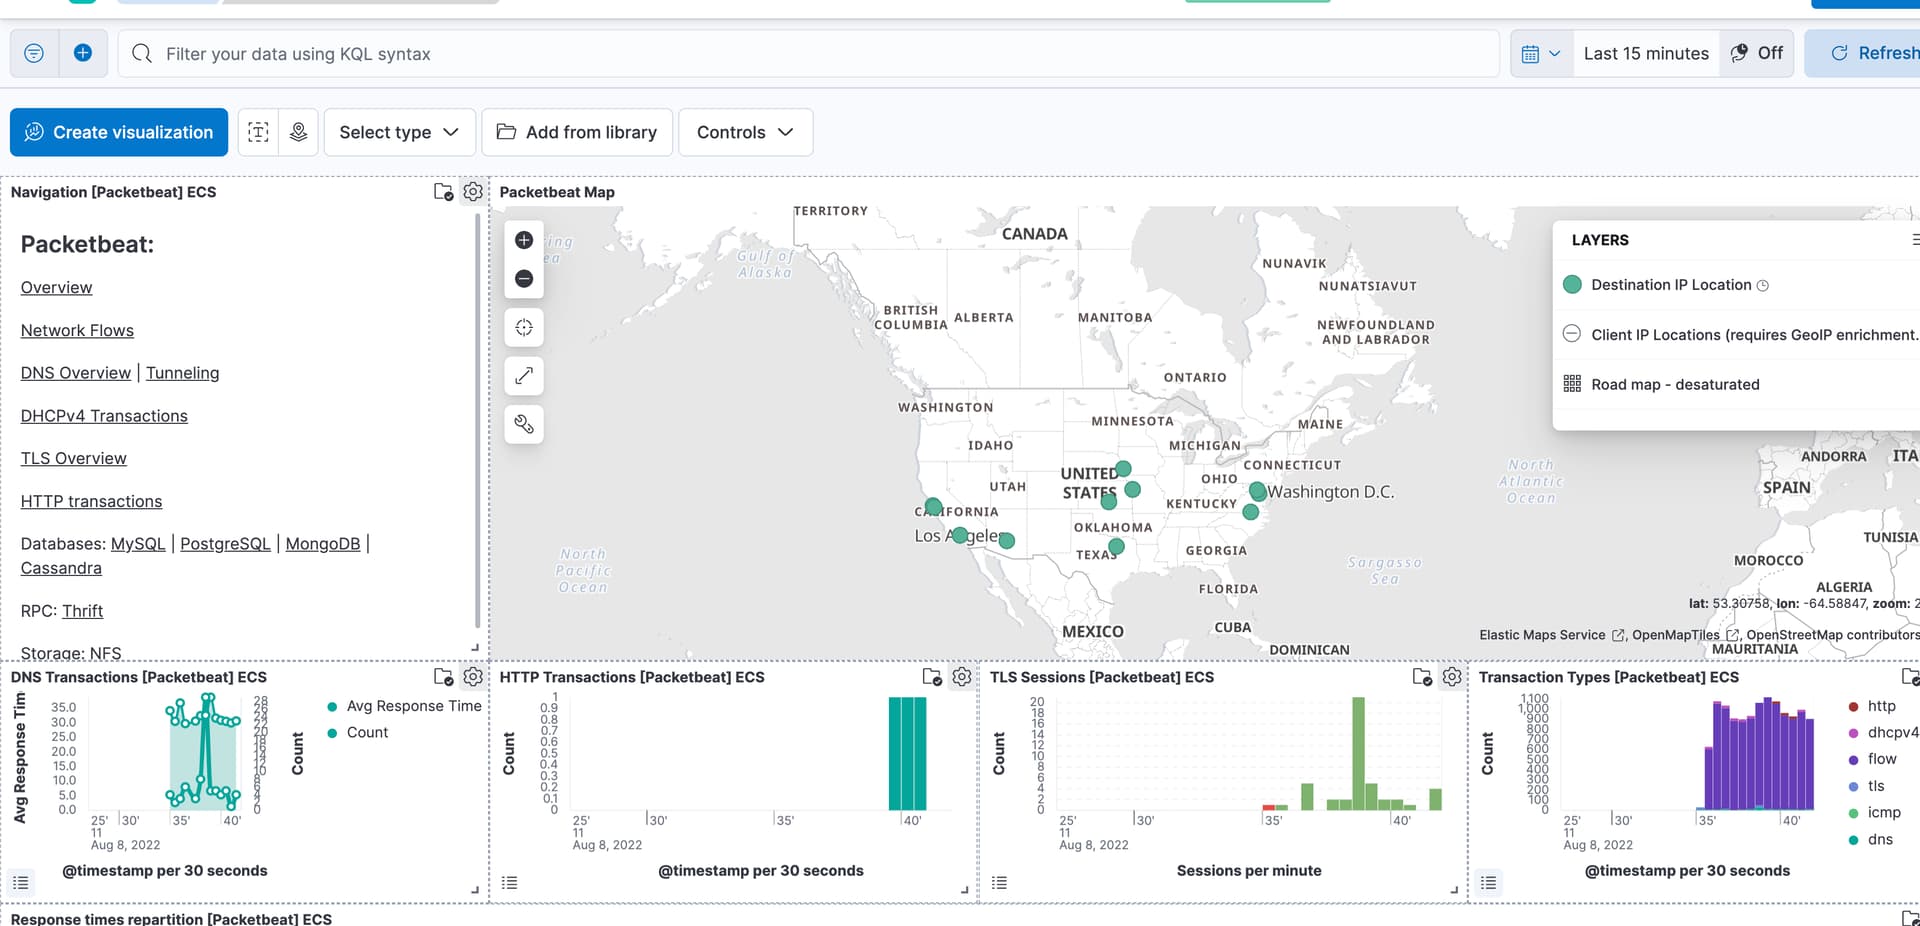
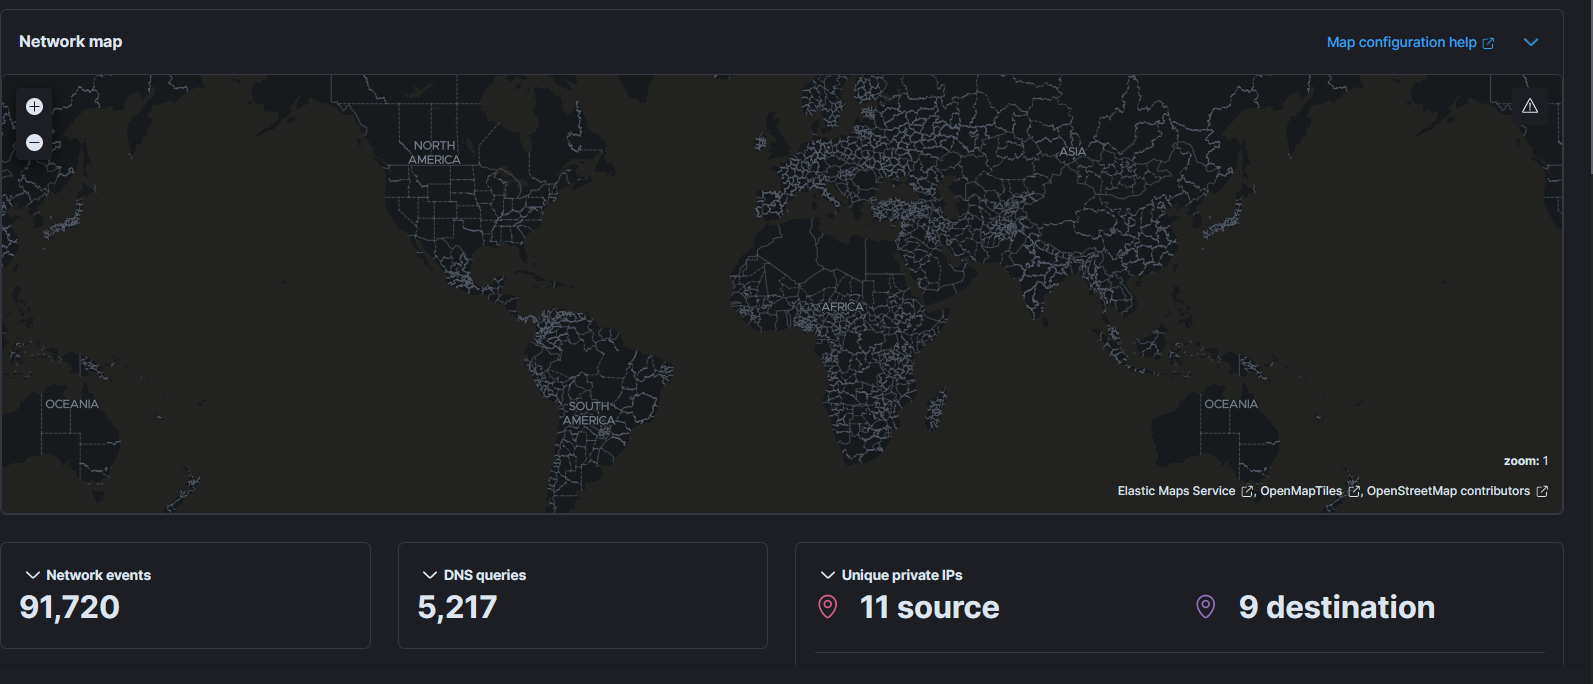
Did you every disable the GeoIP Database?
While troubleshooting the issue (before posting here), i followed this : https://www.elastic.co/guide/en/kibana/7.17/maps-connect-to-ems.html

To disable EMS, change your [kibana.yml]
1. Set `map.includeElasticMapsService` to `false` to turn off the EMS connection.

I turned it to true again and disbaled it
Did change one of settings?
No