Charts report different rates depending on the period.
This apply to all X-pack monitoring charts from Kibana.
Here is an example with "Beat" monitoring, with the period " week to date":

Did I really process more than 600 000 events/s the 4th of April? 
Let's zoom on that day:
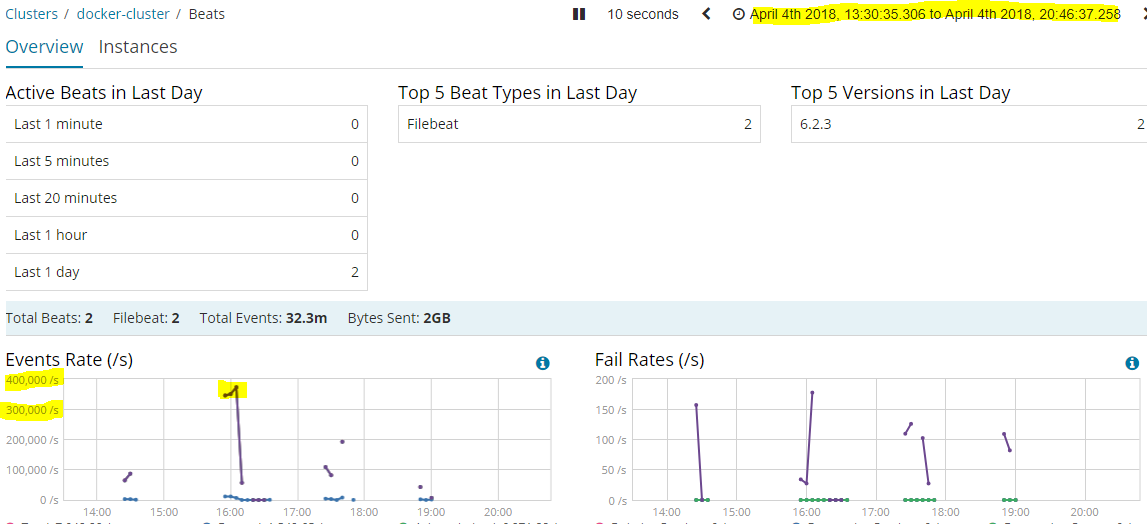
ok so now it says it's 300 000 events/s? still crazy number
Let's zoom again:
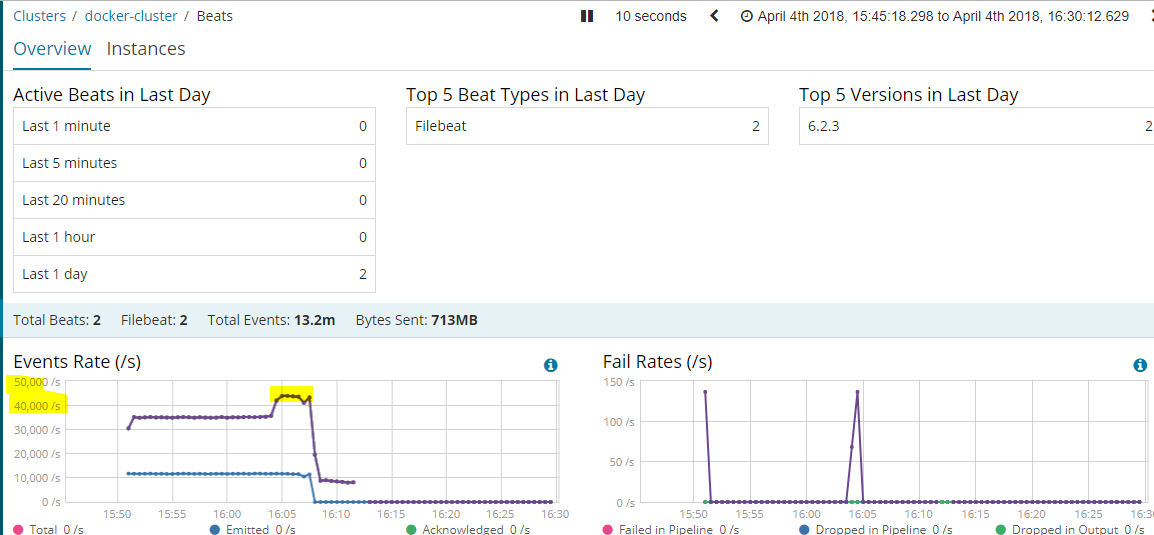
much more reasonnable,
But let's zoom again becasue I don't remember this rate:
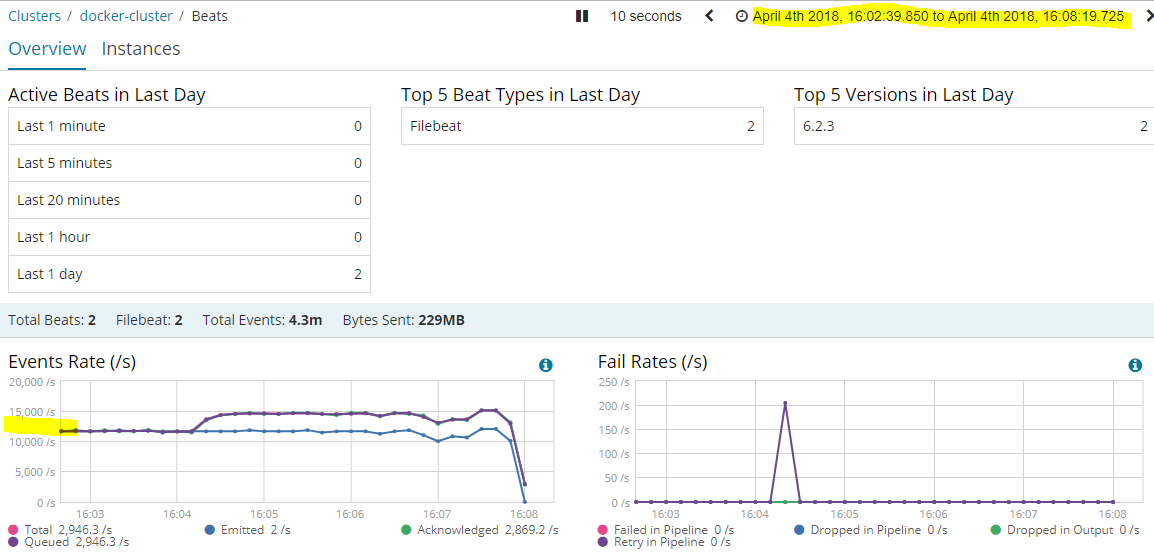
Up to 15k e/s, this one is correct
Sounds like a bug right?
The same apply to Elasticsearch and logstash, but this time it increases while I reduce the period. Weekto date with LS:

If I zoom max:
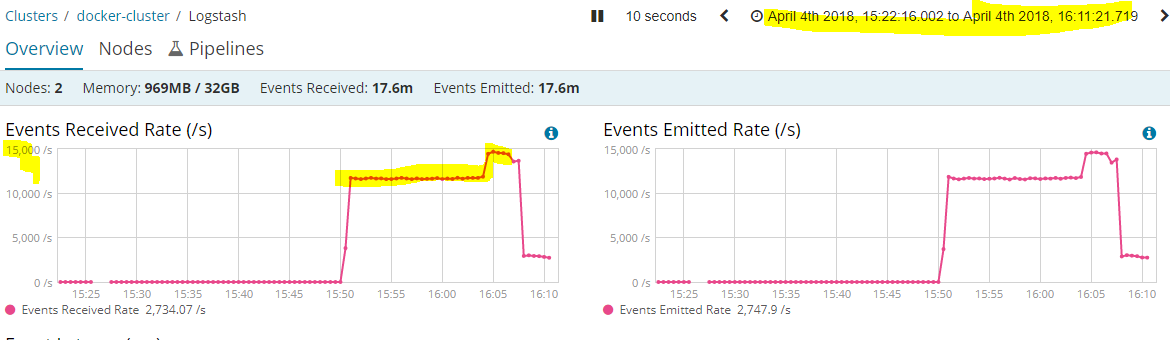
The latter is correct, I remember this test, I was checking with iostats and the metric logstahs plugin at the same time.
thanks,
Rod
ELK Version 6.2.3 hosted on Docker 18.03.0-ce
Filebeat Version 6.2.3 hosted on CentOS 7