Advanced JSON input

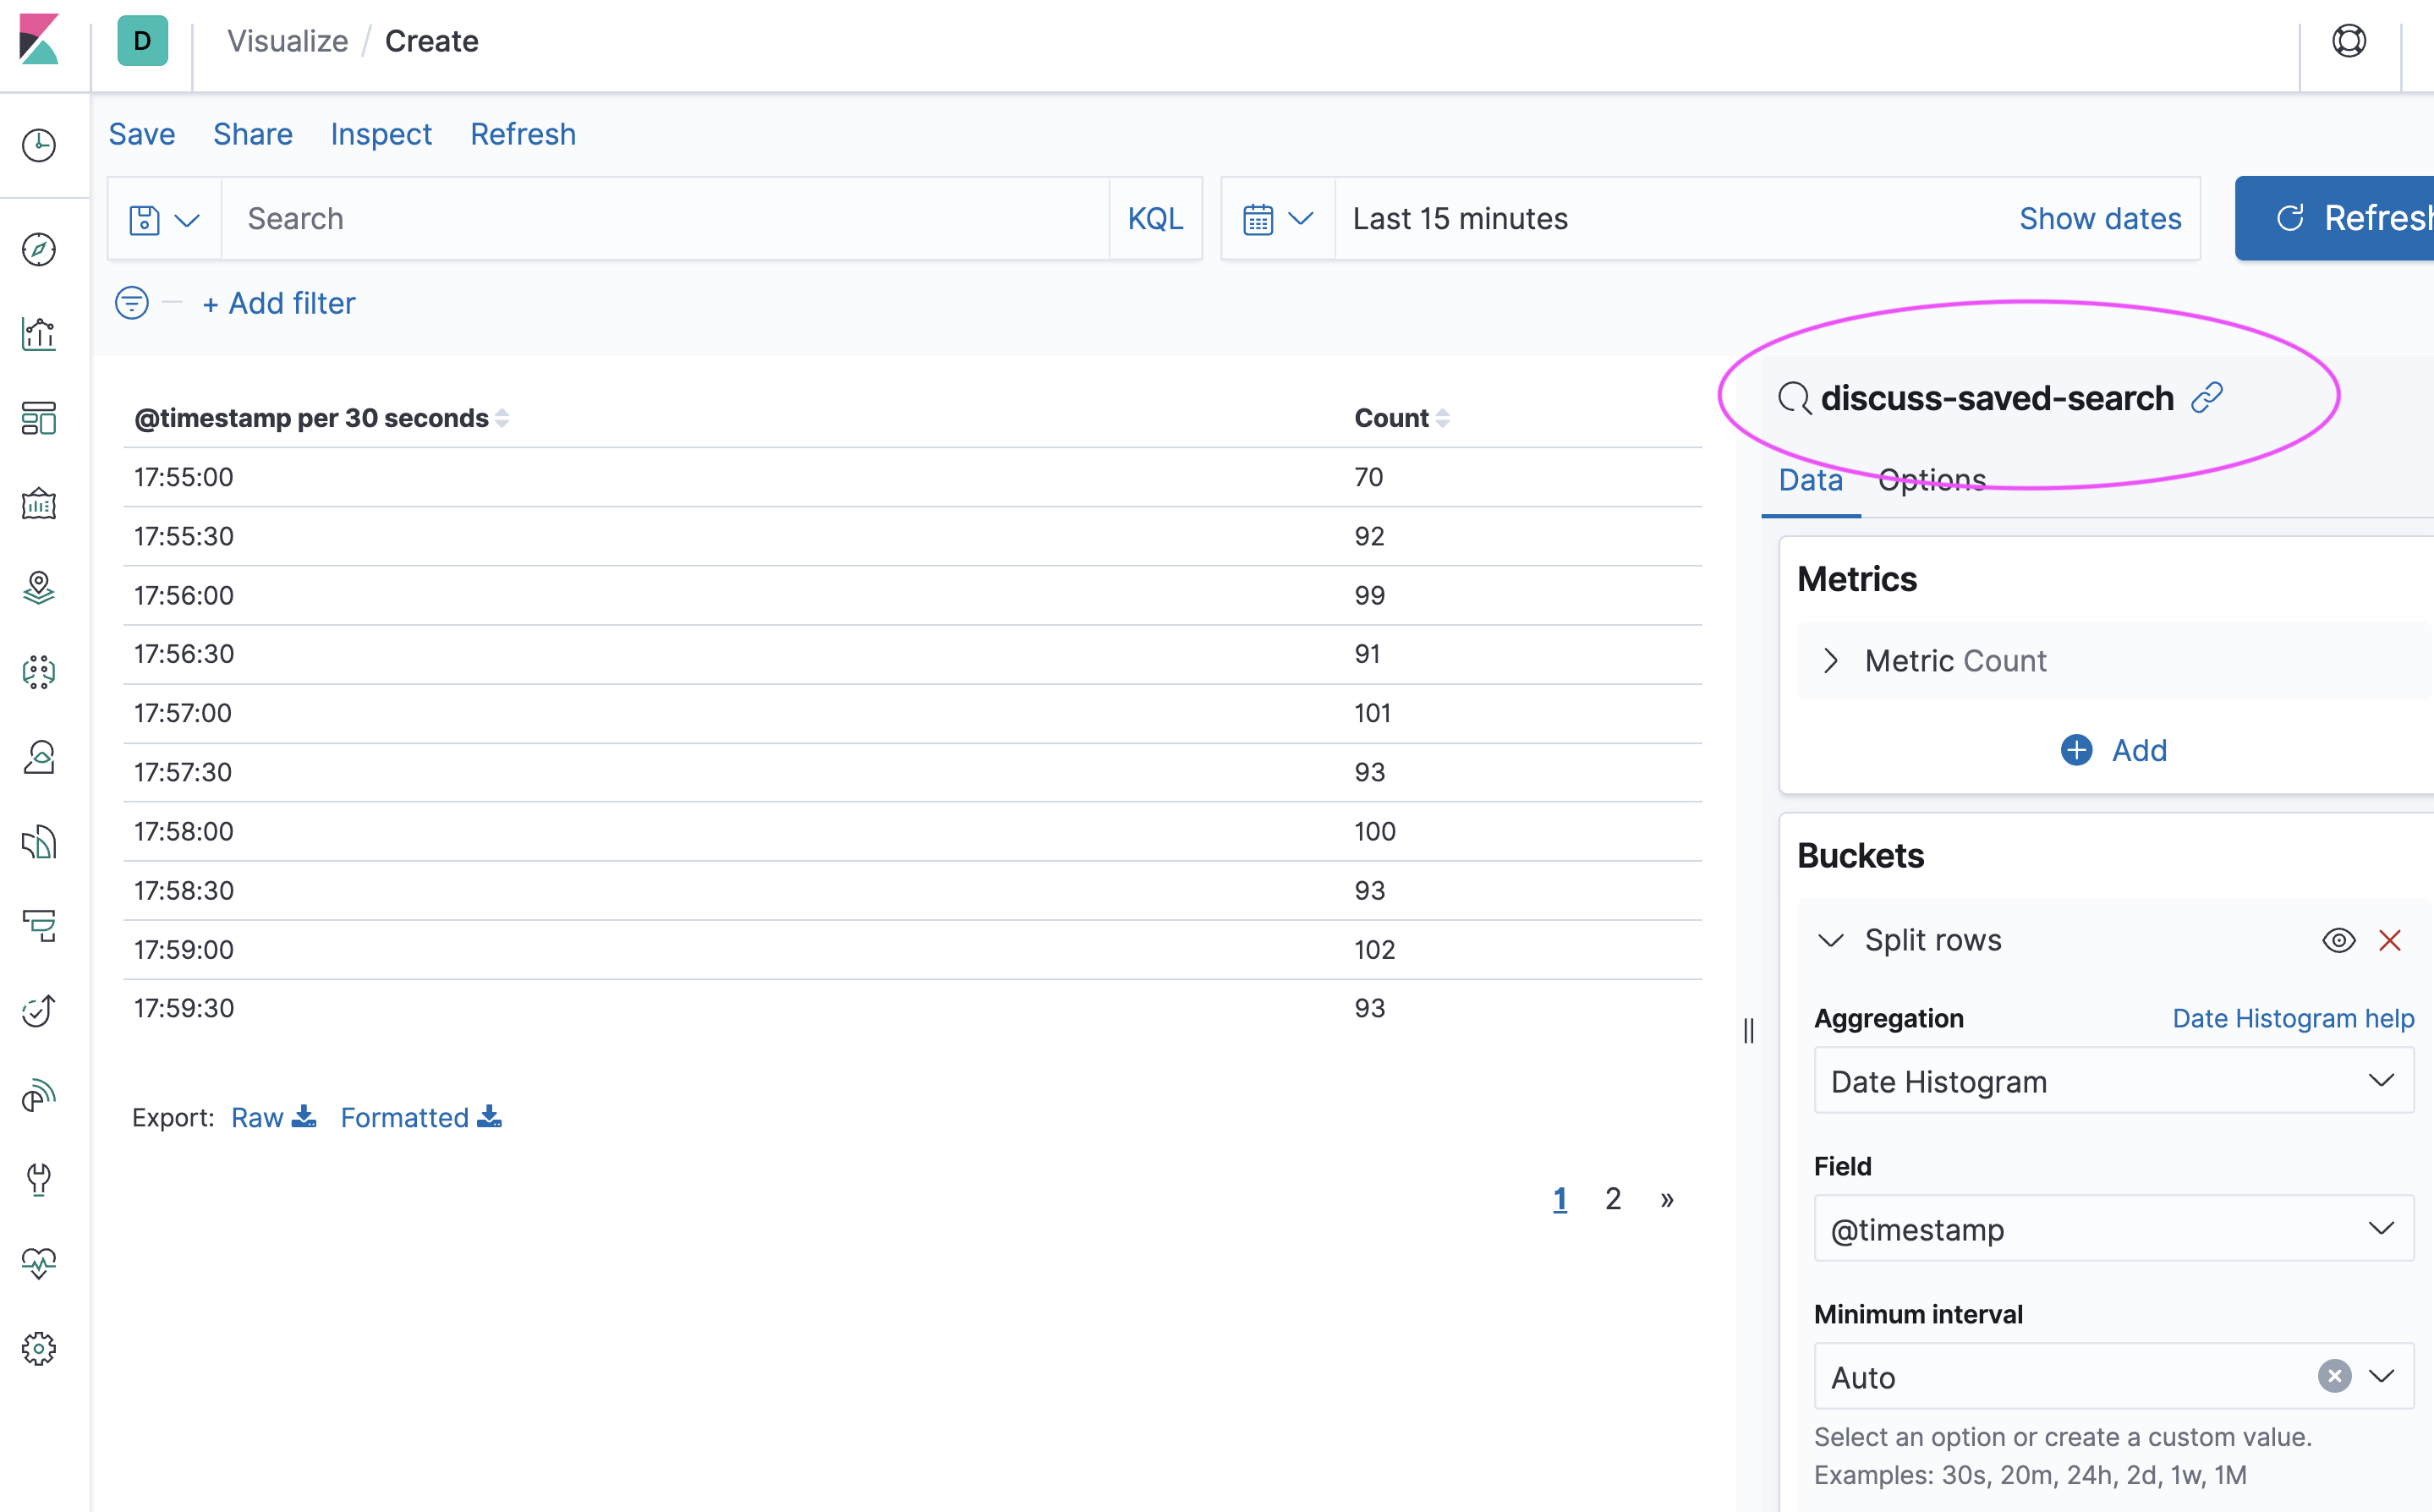
I have a data table with data, Metrics, aggregation as count. ( as it shows all the log count)
see attached image(if avl)

i wish to get only the count of 5xx errors (500-599) in downstreamStatus data field using advanced json input field.
i have downstreamStatus as data field in filter field, but do not wish to apply that in "add filter" section.

is this achievable using advanced JSON input field ?

Hi @imsudo Welcome to the community!

What version of the Stack...

Lens you can put the KQL filter in the aggregation formulas.

In general if you are on a newer version you should start with Lens

Or using the legacy Table you can base the viz on a saved search

hi @stephenb
It's v 7.7.0

so how can i base the viz on saved search.. ?

Go to Discover
set the index pattern
Set the filters
Save
Then use that saved search when creating the visualization.

BTW 7.7 is incredibly old and you should upgrade as soon as possible.

i did google version 7.7.0 is on 13th May 2020...

i tried but in Visualization - new Visualization - data table - choose source and .......... same place.. no option to use the saved one

Yes, that is nearly 3 Years old and over 15+ Significant Releases behind... just a suggestion.

Hmmm Right Here in the 7.7 Docs

The most frequently used visualizations allow you to plot aggregated data from a >>saved search<< or index pattern.

The most frequently used visualizations include:

  • Line, area, and bar charts
  • Pie chart
  • Data table
  • Metric, goal, and gauge
  • Tag cloud

So here is my 7.7 works fine

Discover

Data Table

Pick the Saved Search

Build Table off Saved Search

1 Like

This topic was automatically closed 28 days after the last reply. New replies are no longer allowed.