Hi all, I'm trying visualize data based on an aggregation of a certain column. In this case, its company name. Throughout my data, company names are not standard, and I would like to find a way to either pre-aggregate the data, or I was wondering for the possibility of aggregating the data based on common terms in the company name field. For example, in the following image, there are many different ways Microsoft can be written.
This is just a sample that I made, however, in general the names can differ more, but will always have the company name, ex: Microsoft.
I did a bit of research, but couldn't find a similar application in the forums. Right now I broke it down to a couple of options:
Pre-aggregate the data with some python script
Pre-aggregate the data with logstash, however there is a lot of data, with many variations, so I dont know how applicable this is
If possible, a direct visualization with the most common terms throughout all the fields, and then filter out/ ignore the unneeded terms (like LLC, INC.)
Thank you so much for your help! I'm sorry if this is a little vague, or an open ended question. But I was just wondering if this has appeared before in the forums, or if there is even a solution going forward.
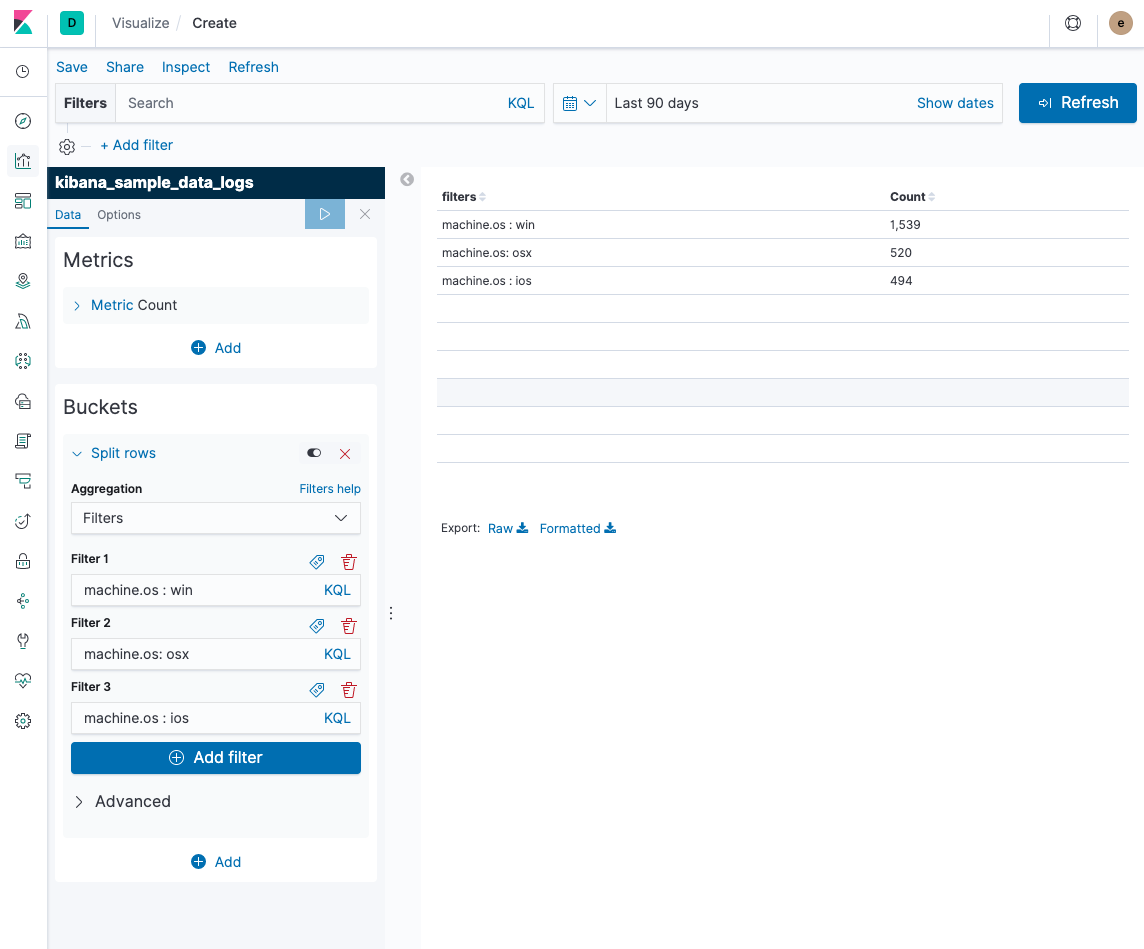
Is there a fixed number of company names you need to aggregate on? If so you could just use a filters agg for your buckets and craft a query that matches all of the names a particular company goes under. For your example, if company name is a text field using the standard analyzer, the KQL query would literally just be company name:microsoft
Thank you Bargs, this is good for a single use case, or for the bigger companies, so thank you for that.
For example, If i would like to create a visualization of how many company entries their were, I would need an automated way to catch all the company names. Is it possible to query out, for example, all names with 'microsoft', and then maybe add another column to all the caught entries with a simplified company name? Because in my actual dataset, there's hundreds of different company names.
Hmmm, I'm not sure I understand. Are you wanting to pick out common parts of the company names in an automated fashion without having a predefined list of canonical names?
Yes, that would be best case scenario. However, also picking out a predefined list of canonical names would also be completely applicable. The most important part of this is just being able to visualize all aggregations of a company as one. For instance, to allow us to see the most entries per company.
The KQL query earlier is a perfect example of what I'm looking for, but it only applies to that 1 company queried out. Do you know of a way to add the term used in the query as a column for each data entry (if this makes sense)?
Again, I know this is a less technical question, so thank you so much Bargs.
Sorry if I'm still misunderstanding, but if I had a predefined list of company names I would create a filters agg with a query matching all the variants for each of those company names. One filter per canonical company name. Something like this:
Apache, Apache Lucene, Apache Hadoop, Hadoop, HDFS and the yellow elephant
logo are trademarks of the
Apache Software Foundation
in the United States and/or other countries.