TLDR: How do I make the empty cells in the table below show the same data as the non-empty cells when the value shown in the first column is the same.
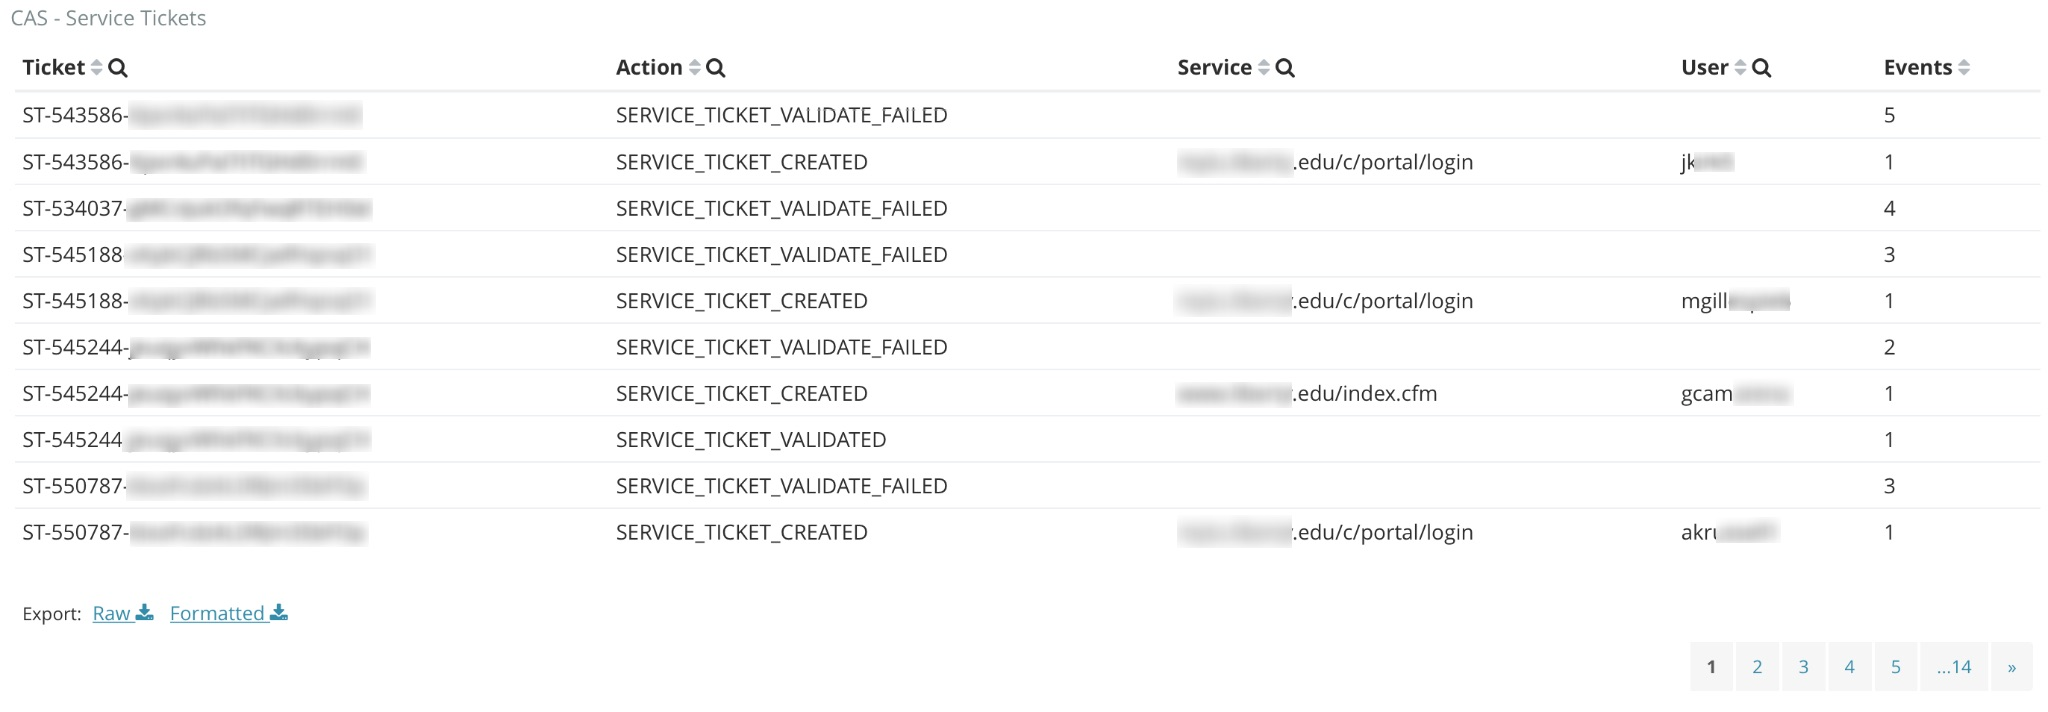
I am ingesting audit logs from my enterprise CAS stack witch handles single sign on for hundreds of services. Each type of action (authentication, granting ticket created, service ticket created, service ticket validattion success/failure, etc) has different fields with one or two common fields being shared. I want to be able to query accross these action types using common fields. The data table aggregation below probably explains this a lot better than I could in words:
As you can see from the aggregation above, there are some services trying to use the same service ticket more than once. When this happens, CAS will fail the validation attempt because service tickets are single use. If I see a spike in service ticket validation failures like the aggregation below shows, I want to be able to filter to that action and see the services and users belonging to each service ticket that failed validation via the table aggregation above. But since service and user are only logged in the service ticket created action, I loose that information when I filter to service ticket validate failed or success and only see the service ticket itself.
as I understand your use-case you want to fill missing fields in documents via lookup from earlier documents. My recommendation would be to do this at index time. You didn't mention how you are ingesting those documents. If you are using Logstash, the Elasticsearch input filter can perform such lookups.
I am using the full elastic stack (beats>logstash>elasticsearch>kibana). Sorry for not mentioning that in the original post.
To your suggestion; I have considered using the elasticsearch input filter to fetch the data from the first event (SERVICE_TICKET_CREATED). My CAS stack is running at about 10ms average request time which means 10ms for a service ticket to be created and 10 ms for the service to validate the ticket. My concern is that the SERVICE_TICKET_CREATED event won't even be indexed by the time the SERVICE_TICKET_VALIDATE event is being parsed.
Also, I am running multiple logstash instances with beats load balancing which means the events could go to separate instances, one of which could be running slower than the other at which point the events can get processed in reverse order and then I'd never be able to get the data added via this method as the event I would want to add to would be indexed already.
It's true that in this scenario Logstash might be unable to add the missing information at ingest time.
It is probably possible to create an Elasticsearch query using a pipeline aggregation, that returns a result set like the one you are looking for. Unfortunately that is not supported by Kibana yet (see the issues for pipeline aggregation.
Another way to display what you want on a dashboard might be the top_hits aggregations, support for which might be landing in 5.3 (see the PR for top_hits aggregration).
Until then maybe a post-processing cron job could add the missing fields to the documents?
I might be able to get a version of what I'm looking for with top_hits. The pipeline aggregation would probably resolve this issue a little more in line with what I'm looking for but potentially expensive since the data is built the way I want it at search time. It seems what I really need would be some kind of nested objects support and reindex the actions, services, and users as part of a service ticket object.
Apache, Apache Lucene, Apache Hadoop, Hadoop, HDFS and the yellow elephant
logo are trademarks of the
Apache Software Foundation
in the United States and/or other countries.