We have been experiencing some on going issues since we have upgraded to 8.9.1 from 7.17.11. Primarily all our issues have been with Kibana's Security SIEM.
There are two main issues that we have been experiencing:
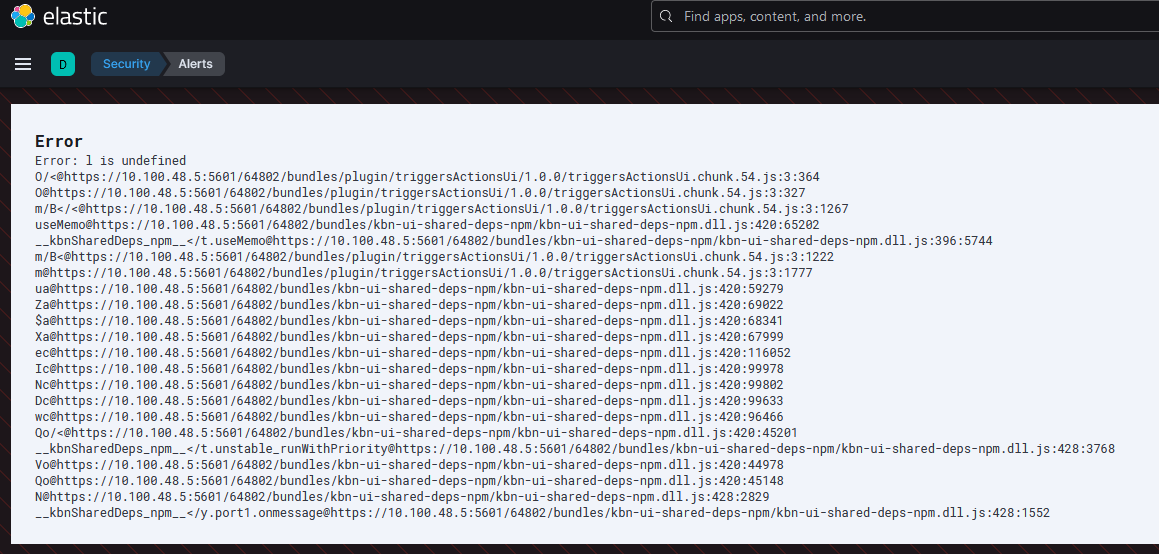
- Certain alert information appear blank on the dashboard and when you try to open one of the alerts kibana shows an error (screenshots below)

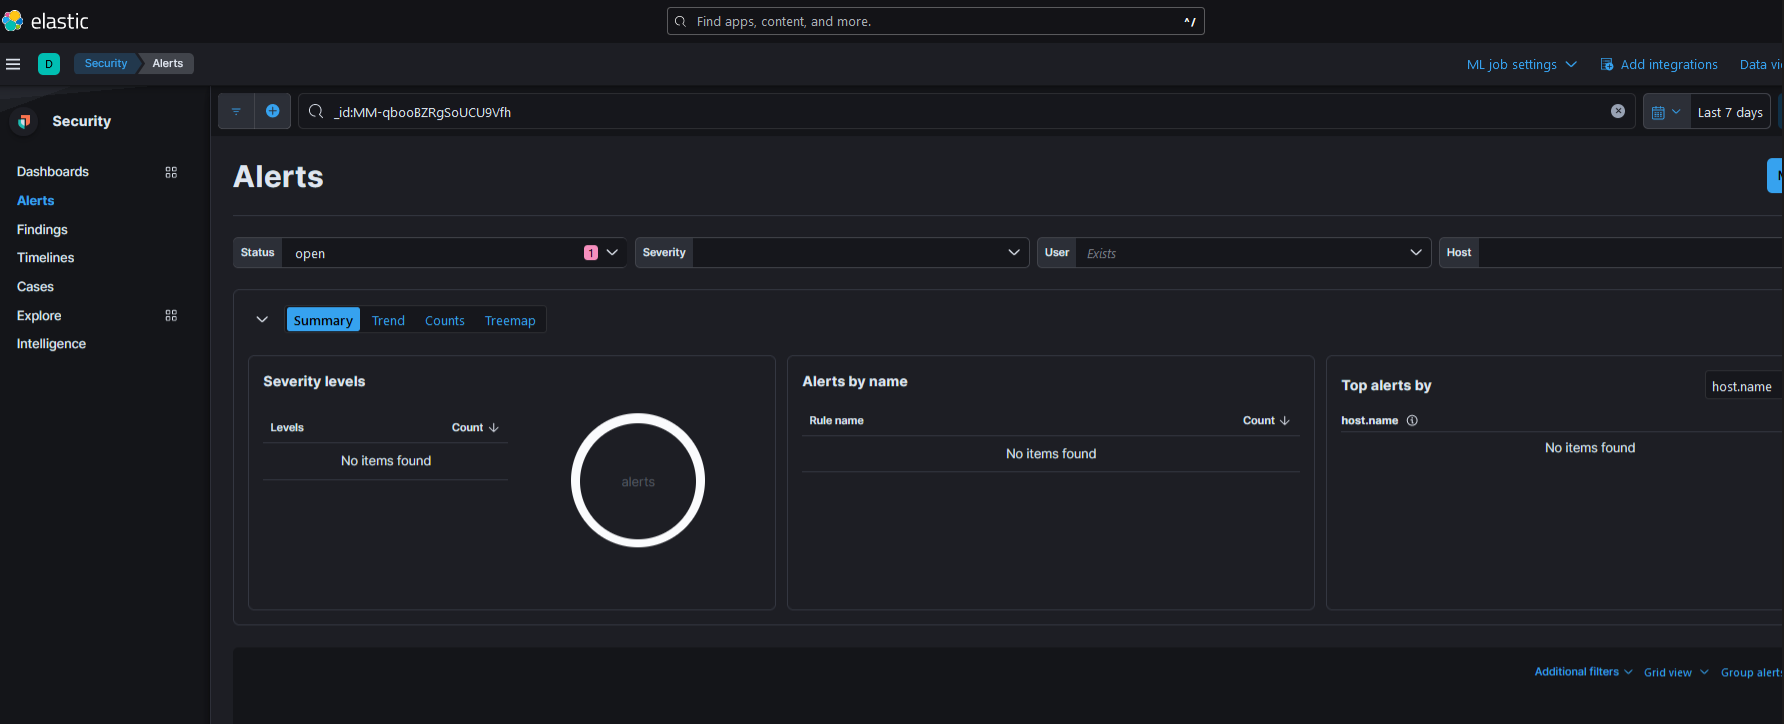
- We are receiving email alerting from Elastalert2 for certain alerts, however when you look on the main security dashboard the alert does not appear but when you search specifically for the rule we can see the detections that were raised.
Alerts within Rule:

Security Dashboard searching for rule:
Has anyone else been experiencing similar issues, could suggest an approach to resolve these issues?