I feel like the attached image should not be possible since it's checking every minute and CLEARLY should be active, but is in an okay state? Alerts only become active one time for me... Once they recover, they seem to never alert again.
update: The alert finally fired again much later. "Only on state change" should be causing it to alert immediately again if it was in a recovered state, though. Still seems super broken.

Hi @ShadwDrgn welcome to the community.
Before we start debugging can I ask you what version you are on?
The alert Only on State change was introduced in 7.11.0 and there were a couple bugs that have been fixed in 7.11.1 and 7.11.2 if possible I would get to the latest.
If you are already at 7.11.2 good.
I also notice missing data.. is that intentional?
I believe the Status OK to the left does not change while you are setting up the Alert only after it is saved and starts executing.
I'm on 7.11.1 from dockerhub updated last night. The rest of the page is just alert connectors and there are no filters. the alert is saved. I only brought up the edit so i could screenshot it. This alert had been running and even alerted the first time disk went high... then it recovered and sent me the rrecovery... but then never went active again even though it clearly should have.
Can you try 7.11.2 ... I have tested that exact scenario with CPU and it worked as expected,
Fired - Recover - Fire
not to say you a not seeing a bug ... Can you show the whole alert setup?
Are you grouping by host, filesystem or device?
I also notice you have dropped data, not sure if that is affecting it.
Also I think fstat by default is collected at a much slower interval how do you have metricbeat setup for that
- module: system
  period: 1m
  metricsets:
    - filesystem
- fsstat7.11.2 doesn't seem to be available on docker hub
Interesting... Huh I just pulled from our official repo, but I see it is not on Docker Hub yet... not sure why
docker pull docker.elastic.co/elasticsearch/elasticsearch:7.11.2
Also if you are not grouping by something host, filesystem etc... then it is just looking at the aggregate... I notice you are doing a raw metric threshold perhaps you should start with and Inventory threshold ... then it is grouped by host. I have noticed that Filesystem can be a bit trickier because of multiple filesystem so that MAX you are looking at could be accross multilpe filesystems (if that is how your system is set up)
So I just ran a Fired -> Recovered -> Fired on CPU and it seems to be working as expected in 7.11.2
I think we just need to get your data and alert squared away.
#######
# FIRED
######
{
"alertActionGroup" : " `metrics.invenotry_threshold.fired` ",
"alertActionGroupName" : "Fired",
"alertId" : "c71b7e20-6bc1-11eb-a7b0-8926a7d900e8",
"alertInstanceId" : "stephenb-metrics-test",
"alertName" : "test-cpu-fire-recover",
"context.alertState" : "ALERT",
"context.group" : "stephenb-metrics-test",
"context.metric" : "{"condition0":"cpu"}",
"context.reason" : "CPU usage is greater than a threshold of 80 (current value is 90.4%)",
"context.threshold" : "{"condition0":[80]}",
"context.timestamp" : "2021-03-14T17:05:53.725Z",
"context.value" : "{"condition0":"90.4%"}",
"date" : "2021-03-14T17:05:53.727Z",
"spaceId" : "default",
"tags" : ""
}

#######
Alert Recovered
#######
{
"alertActionGroup" : "recovered",
"alertActionGroupName" : "Recovered",
"alertId" : "c71b7e20-6bc1-11eb-a7b0-8926a7d900e8",
"alertInstanceId" : "stephenb-metrics-test",
"alertName" : "test-cpu-fire-recover",
"context.alertState" : "",
"context.group" : "",
"context.metric" : "",
"context.reason" : "",
"context.threshold" : "",
"context.timestamp" : "",
"context.value" : "",
"date" : "2021-03-14T17:07:56.146Z",
"spaceId" : "default",
"tags" : ""
}

#######
# FIRED
######
{
"alertActionGroup" : " `metrics.invenotry_threshold.fired` ",
"alertActionGroupName" : "Fired",
"alertId" : "c71b7e20-6bc1-11eb-a7b0-8926a7d900e8",
"alertInstanceId" : "stephenb-metrics-test",
"alertName" : "test-cpu-fire-recover",
"context.alertState" : "ALERT",
"context.group" : "stephenb-metrics-test",
"context.metric" : "{"condition0":"cpu"}",
"context.reason" : "CPU usage is greater than a threshold of 80 (current value is 89.5%)",
"context.threshold" : "{"condition0":[80]}",
"context.timestamp" : "2021-03-14T17:11:05.775Z",
"context.value" : "{"condition0":"89.5%"}",
"date" : "2021-03-14T17:11:05.777Z",
"spaceId" : "default",
"tags" : ""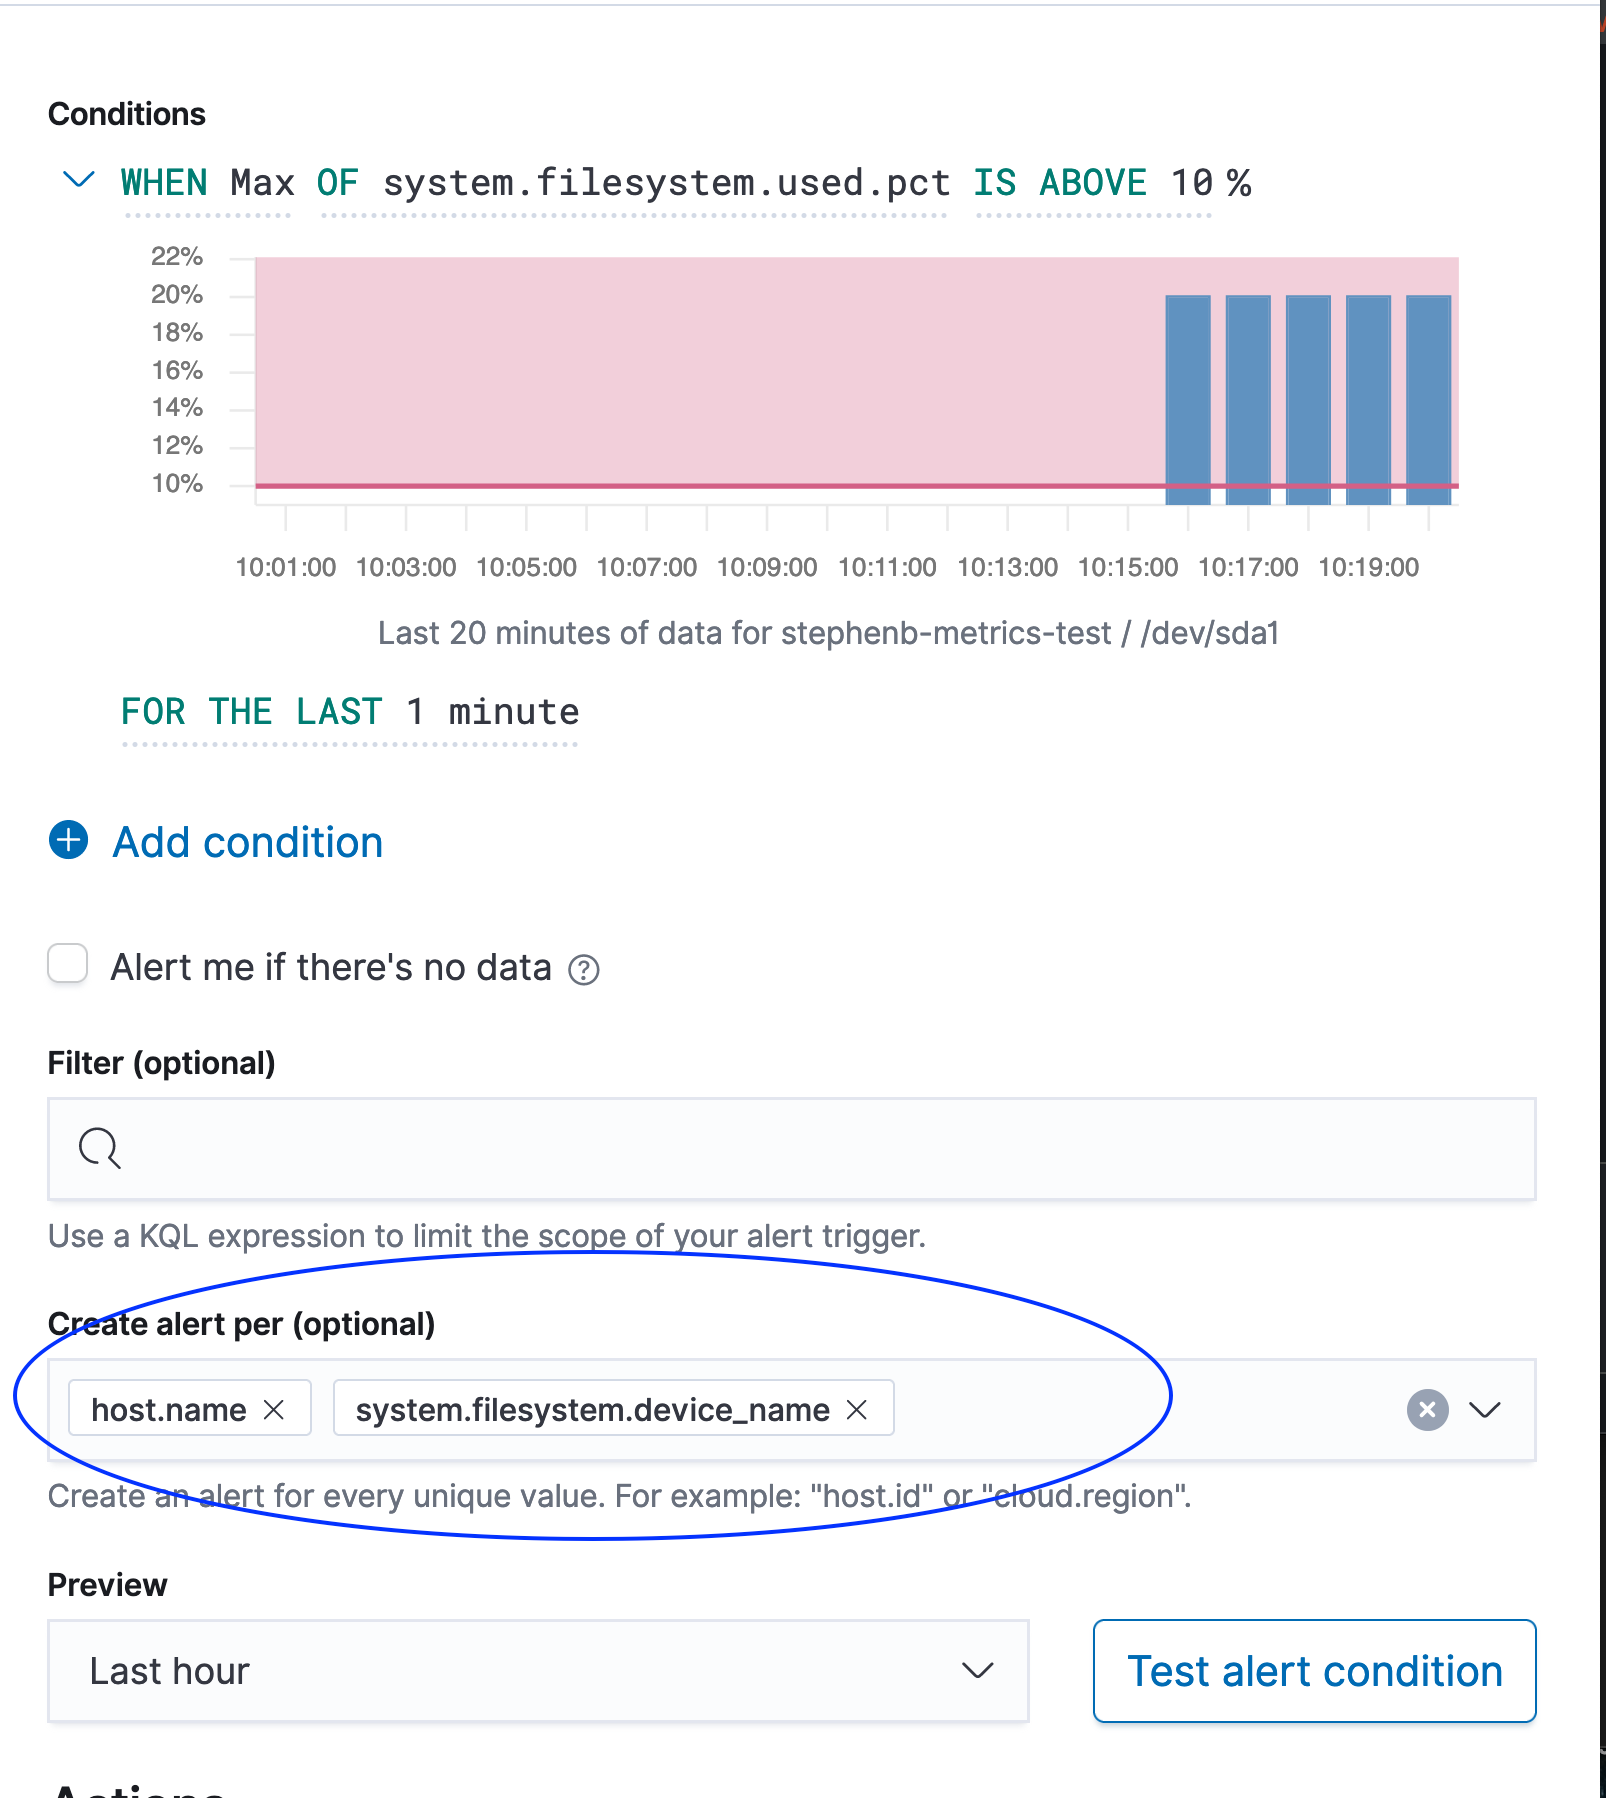
}So I think you are going to need to do some Create Alert Per etc.
Think of Alert Per : host.name Per system.filesystem.device_name (example below) which is probably what you actually want.
Otherwise your 1 alert is across all host and all filesystems...
Whether you want to group by device_name or mount_point is your call.
I will revisit this at a later date actually. It's possible this may be something to do with aggregation and I may even be dumb and have a filter in but the filter is basically filtering only for a specific device. The alert does seem to trigger again after enough time has passed, wwhich is why I think it's nothing to do with all that though. I'll update to 7.11.2 at a later date and re-test. for the moment this is in dev and isn't important anyway. Thanks for all your help.
Fair enough ...
Filter is a good way to test.
Check the collection interval on the filesystem metrics.
If I get a chance I will try to recreate if you could share the whole alert setup I will take a look.
If not let us know when you get back to it.
Hi @ShadwDrgn
Little followup, for when you get back to this I did test and it did appear to work OK /As expected. That is not to say there could still be an issue somewhere.
This framework is all fairly new over the last several release, and there were certainly bugs and there are still a few quirks and the docs are evolving. This caught my eye because I helped identify a few bugs in those early releases and in 7.11.0.
That said looks like it is working, ping back if you have issues.
I / we appreciate your feedback when try it especially for the first time, if there are things we can make better please let us know.
Below you can see my config.
I think there are a couple things that may give the appearance of not working right.
First, When the alert first gets saved / submitting it take a little bit of time for it to start executing.
2nd if metricbeat / elastic agent is set to collect filesystem every 1min and the Alert Checks Every 1min and it Needs to be over the Threshold for 1min its possible it can be just less than 2 mins before the first alert actually fires after it gets put in the queue to execute. The same will hold true for the recovered alert.
Also the little graph needs a little tuning I think, sometimes it is hard to interpret, it has a 20 min and yet we are trying to see 1 min... if that make sense, good for a trend, perhaps not for a specific min etc.
In the real world when you create an Metric Alert even if you filter you will probably want to do Alert Per host.name and system.filesystem.device_name (or whatever) so those terms show up in the Alert Context, if you only do a filter... the filter does not show up in the alert context.
I have included what my alert looks like plus my alert Fired and Recovered Message looks like some reason we don't have a 1 click way to do that.


These are my actions
{
  "message" : "FIRED Filesystem Alert",
  "alertActionGroup" : "{{alertActionGroup}}",
  "alertActionGroupName" : "{{alertActionGroupName}}",
  "alertId" : "{{alertId}}",
  "alertInstanceId" : "{{alertInstanceId}}",
  "alertName" : "{{alertName}}",
  "context.alertState" : "{{context.alertState}}",
  "context.group" : "{{context.group}}",
  "context.metric" : "{{context.metric}}",
  "context.reason" : "{{context.reason}}",
  "context.threshold" : "{{context.threshold}}",
  "context.timestamp" : "{{context.timestamp}}",
  "context.value" : "{{context.value}}",
  "date" : "{{date}}",
  "spaceId" : "{{spaceId}}",
  "tags" : "{{tags}}"
}

{
  "message" : "RESOLVED Filesystem Alert",
  "alertActionGroup" : "{{alertActionGroup}}",
  "alertActionGroupName" : "{{alertActionGroupName}}",
  "alertId" : "{{alertId}}",
  "alertInstanceId" : "{{alertInstanceId}}",
  "alertName" : "{{alertName}}",
  "context.alertState" : "{{context.alertState}}",
  "context.group" : "{{context.group}}",
  "context.metric" : "{{context.metric}}",
  "context.reason" : "{{context.reason}}",
  "context.threshold" : "{{context.threshold}}",
  "context.timestamp" : "{{context.timestamp}}",
  "context.value" : "{{context.value}}",
  "date" : "{{date}}",
  "spaceId" : "{{spaceId}}",
  "tags" : "{{tags}}"
}
And this is what a result looks like....
it does bother me that the host.name does not show up in the context.group and a few other fields are missing in the resolved, I think I will write that up, but it does show in the alertInstanceId and the 2 but the 2 alerts are tied by the alertId as well.
{
     "message" : "FIRED Filesystem Alert",
     "alertActionGroup" : "metrics.threshold.fired",
     "alertActionGroupName" : "Fired",
     "alertId" : "944b7010-8528-11eb-a8a7-9feb424b7003",
     "alertInstanceId" : "stephenb-metrics-test, /dev/sda1",
     "alertName" : "test-filesytem",
     "context.alertState" : "ALERT",
     "context.group" : "stephenb-metrics-test, /dev/sda1",
     "context.metric" : "{"condition0":"system.filesystem.used.pct"}",
     "context.reason" : "system.filesystem.used.pct is greater than a threshold of 25% (current value is 28.4%)",
     "context.threshold" : "{"condition0":["25%"]}",
     "context.timestamp" : "2021-03-15T01:24:00.000Z",
     "context.value" : "{"condition0":"28.4%"}",
     "date" : "2021-03-15T01:25:05.205Z",
     "spaceId" : "default",
     "tags" : ""
   }

{
     "message" : "RESOLVED Filesystem Alert",
     "alertActionGroup" : "recovered",
     "alertActionGroupName" : "Recovered",
     "alertId" : "944b7010-8528-11eb-a8a7-9feb424b7003",
     "alertInstanceId" : "stephenb-metrics-test, /dev/sda1",
     "alertName" : "test-filesytem",
     "context.alertState" : "",
     "context.group" : "",
     "context.metric" : "",
     "context.reason" : "",
     "context.threshold" : "",
     "context.timestamp" : "",
     "context.value" : "",
     "date" : "2021-03-15T01:28:14.413Z",
     "spaceId" : "default",
     "tags" : ""
}Hey @stephenb Thanks for all of this. I haven't had time to get back to this as yet, but I will say that one slightly frustrating thing was that a lot of data is missing from the recovery. suspect I understand why this is, but it would be nice if some of the context data were present in the recovery data. for example:
context.alertState is empty when it should probably be "OKAY" or "RECOVERED" or something like that
context.threshold should still contain the threshold for the alert so that I can say in my recovery "the metric has recovered from passing the {{context.threshold}}" or something.
context.metric would be good to have in a recovery too so that people know what is being restored. for example one might have a cpu AND a memory alert that's recently triggered for the same machine, but they would have to basically look at the GUID to know which thing recovered.
Finally the only way I've seen so far (on brief inspection admittedly) of discovering what is recovering in general for an alert is alertInstanceId which I have to put in both the alert and recovery so that people know what recovered.
If context.group is supposed to contain which host (if alerting separately by host.name for example) alerted, then it should also be present when that particular host recovers.
All of this is of course predicated on the assumption that this is all still true in .2 as i am still on .1
I should be able to write one payload that is identical for both alerts and recoveries eg:
{{context.alertState}}}: {{alertName}} on {{context.group}} threshold: {{context.threshold}} current value {context.value}}\n\n{{msg}}
This would allow you to also cleanly write to other indexes in a manner that would allow very easy alerting reports/metadata/dashboards or craft emails that are consistent. I'm sure there would be other advantages I'm not thinking of to added data. 