"Allocate missing replica shards" X-Pack 5.6.1

After installing and learning how to install all the ELK stack components, getting the pipeline working, watching data flow into ES, I then installed the X-pack plug-in. This broke everything, but I eventually got all the security figured out and once again can now see the pipeline working. The X-pack Monitoring gui is great.

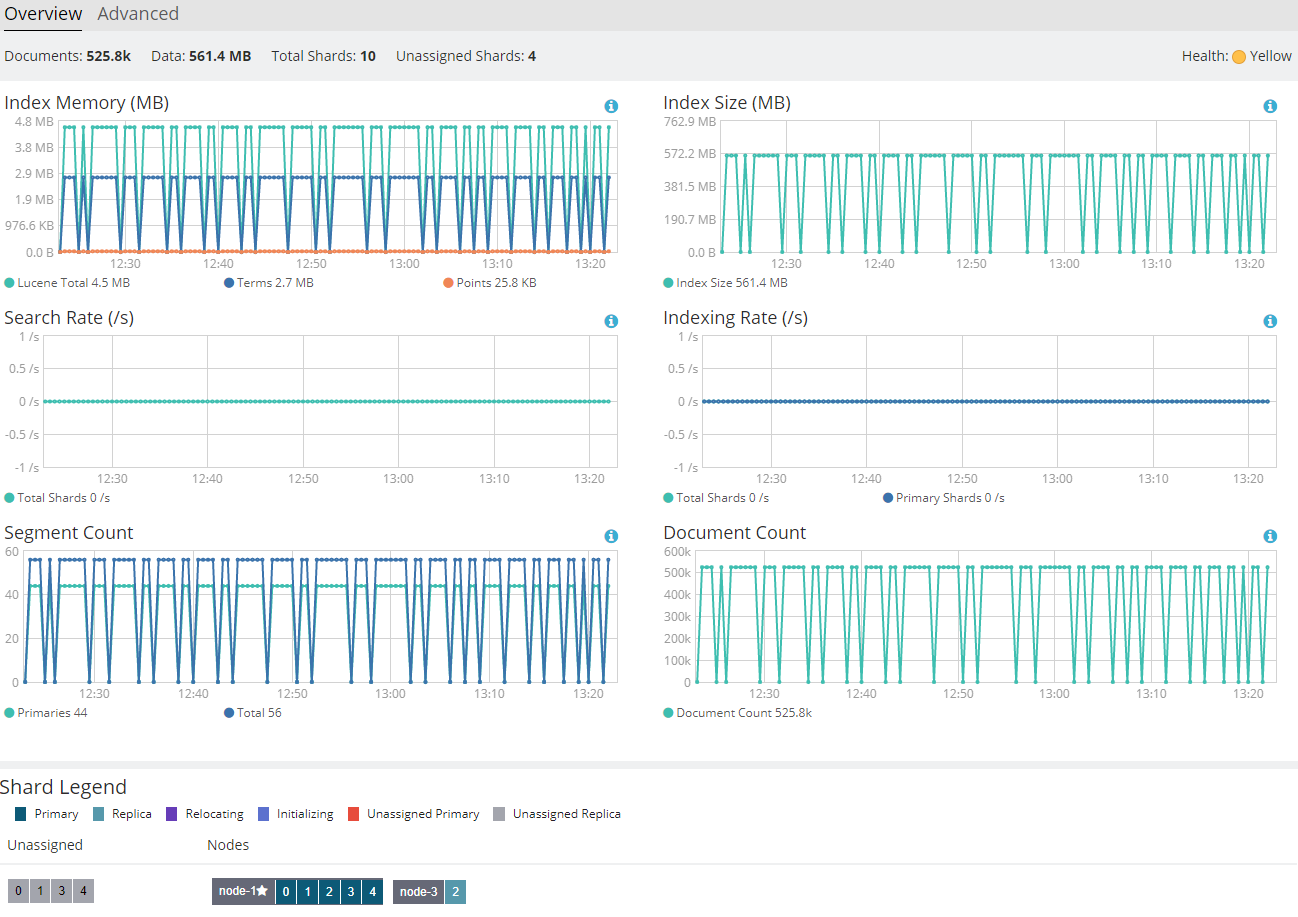
However, now it tells me that "Elasticsearch cluster status is yellow. Allocate missing replica shards."

"Allocate missing replica shards" is a hyperlink, and sounds like an action that will help me, so I click on it, and am taken to a list of indices. I sort by Unassigned Shards and find 2 indices with unassigned shards. 4 in one, 1 in the other.

But... now what? I imagined there would be another button to fix this problem, but I have no clear indication of how to proceed. I see a variety of other posts across the Internet regarding similar problems but they are for older versions and none make mention of how to handle this through x-pack.

I'm willing to learn, but after drinking from the fire-hose for this long am not sure which way to go with this.

Thanks for your time.

Mike

Hi Mike,

The hyperlink takes you to the ES Indices listing to show you which indices have a yellow status due to unallocated replica shards. In order to allocate those shards, you'll need to provision a second node into your Elasticsearch cluster. When a new node joins the cluster, the shards will balance out between the two nodes and all your replica shards will be allocated, and you cluster will have more resiliency.

That is why there isn't anything that the GUI can do beyond showing you that you have indices with yellow status. Adding another node into the cluster is something only the operator can do.

The concept of cluster health is explained here: https://www.elastic.co/guide/en/elasticsearch/reference/current/cluster-health.html

Hope that helps,
-Tim

Thanks for responding @tsullivan.

The cluster already 4 nodes, ingesting data from 2 logstash servers.

I apologize to those who can't view this image, but it's the only way I know how to share this information at this point.

2 screenshots below. 1st is the top of the screen showing the indices listing where all 5 shards are unassigned. 2nd shows contents of the screen for the index "snmptrap-2017.09.20"

I read the "cluster health" link you pointed me at (thanks!) and below have some command output in case it helps.

mike

[root@node ~]# curl -XGET -u elastic:password 'node:9200/_cluster/health?pretty'
{
  "cluster_name" : "argus",
  "status" : "yellow",
  "timed_out" : false,
  "number_of_nodes" : 5,
  "number_of_data_nodes" : 4,
  "active_primary_shards" : 9400,
  "active_shards" : 18797,
  "relocating_shards" : 0,
  "initializing_shards" : 0,
  "unassigned_shards" : 5,
  "delayed_unassigned_shards" : 0,
  "number_of_pending_tasks" : 0,
  "number_of_in_flight_fetch" : 0,
  "task_max_waiting_in_queue_millis" : 0,
  "active_shards_percent_as_number" : 99.97340708435273
}
[root@node ~]# curl -XGET -u elastic:password 'node:9200/_cluster/health/snmptrap-2017.09.20'
{"cluster_name":"argus","status":"yellow","timed_out":false,"number_of_nodes":5,"number_of_data_nodes":4,"active_primary_shards":5,"active_shards":6,"relocating_shards":0,"initializing_shards":0,"unassigned_shards":4,"delayed_unassigned_shards":0,"number_of_pending_tasks":0,"number_of_in_flight_fetch":0,"task_max_waiting_in_queue_millis":0,"active_shards_percent_as_number":99.97340708435273}[root@node ~]#
[root@node ~]#
[root@node ~]# curl -XGET -u elastic:password 'node:9200/_cluster/health/snmptrap?level=shards'
{"cluster_name":"argus","status":"red","timed_out":true,"number_of_nodes":5,"number_of_data_nodes":4,"active_primary_shards":0,"active_shards":0,"relocating_shards":0,"initializing_shards":0,"unassigned_shards":0,"delayed_unassigned_shards":0,"number_of_pending_tasks":0,"number_of_in_flight_fetch":0,"task_max_waiting_in_queue_millis":0,"active_shards_percent_as_number":100.0,"indices":{}}[root@node ~]#
[root@node ~]#

That's problematic, you have far too many shards for that many nodes. Even at half of that count it's too many.

Use _shrink to reduce that count ASAP.

Learning this system is like drinking from a firehose. Doing my best here - can you point me at something that I can read about this?

And/or tell me why there are too many shards, and what a proper shard-count should look like? I realize this may send you down a rabbit-hole you don't have time to traverse, but if you give me some pointers I'll do the reading.

This is very much a default-configuration system, except as needed to implement x-pack, so I'm just a little surprised to hear that there are too many shards...

Mike

1 Like

Kagillion Shards | Elasticsearch: The Definitive Guide [2.x] | Elastic has a good over view.

I don't disagree with that :slight_smile:

So... I read that...

And because I left the defaults alone, my indices are setup to have 5 shards each, and are based on timedate, so are in the format -YYYY.mm.dd.

Should I use shrink to downsize to 2 shards each, or should I be using different indices, perhaps by week or month instead of by day? It's not quite production, I could just purge all data and start fresh. I can't find any guidance that makes sense to me, and would love to hear of some examples.

This cluster is storing syslog, snmp traps and beats output.

Either or. It's easier to shrink the existing ones of course. And weekly/monthly depends on your retention requirements and resources (ie disk).

The best guide is to aim for shards in the 30-50GB range.

@warkolm

It seems like I have to make this change twice - once in all the index templates, so that if I re-create the indices they come up with the right number of shards and replicas (and I don't have to do this again...).

OR... do I follow this: https://www.elastic.co/guide/en/elasticsearch/reference/current/index-modules.html
and update "index.number_of_shards" to "1" (down from the default 5)?

And I also have to make it to the current existing indices.

So... first step would be to turn off my Logstash services to prevent data from being sent to Elasticsearch.

Then, follow the guide here: https://www.elastic.co/guide/en/elasticsearch/reference/current/indices-shrink-index.html

Which will, one index at a time, relocate it to one of my cluster nodes, write it to a new "shrunk" index and then...

what? delete the original? I've been following the guide, and it seems to leave the original index intact. Is it simply an omission that I'm supposed to go back and delete the originals?

It keeps the original index name intact, but the shards underneath are what changes. You don't need to do anything.

Fascinating. I saw the original index name, with the same original properties, with no obvious indication that anything had changed. I saw the new index, with the correct target shard counts. So confusing.

Well... for anyone that is watching...

Here's what I decided to do - since my system isn't in production yet, I have opted to control this on future index creation by using information I learned here: https://www.elastic.co/guide/en/elasticsearch/reference/current/override-default-template.html

and created a new templated called "replica-counts" thusly:

PUT /_template/replica-counts
{
  "order": 0,
  "template": "*",
  "settings": {
    "number_of_shards": "2",
    "number_of_replicas": "1"
  }
}

Tested by deleting an index - which was almost instantly created with new incoming data, inheriting these template defaults.

I can now continue to model data by purging it, continuing to tweak settings until I am getting shards in the range of 30-50GB in size.

2 Likes

This topic was automatically closed 28 days after the last reply. New replies are no longer allowed.