Almost 4 hour delay in documents being received and showing up in Kibana Discover

Kibana: Version: 5.6.13
ElasticSearch: 5.6.13
Ubuntu 18.04
CPUs: 4
Memory: 28 GB

This is running inside a QEMU KVM VM and the box is not heavily taxed.

I ingesting live packets into elasticsearch using tshark.

When I query using Kibana the last record is

Current Kibana Latest Record: April 2nd 2019, 11:00:42.151
Current Time: Apr 2 13:56:45 CST 2019

This is a delay of about 2 hours and 56 minutes

Ideas on how to help speed up the indexing or am I missing something else?

Nobody has any suggestions?? please!

What does an example document look like?

What timezone are you in?

How is the timezone reflected in the document's timestamp?

I'm wondering if the ingested data has a timestamp in the "future"

The documents are actually packets being sent from tshark.

my timezone is GMT-6

This is an example packet:

{"index" : {"_index": "packets-2019-04-09", "_type": "pcap_file", "_score": null}}
{"timestamp" : "1554838586894", "layers" : {"frame_raw": "0",
"frame": {"filtered": "frame"},"eth_raw": "00","eth": {"filtered": "eth"},"ip_raw": "4","ip": {"filtered": "ip"},
"sctp_raw": "5","sctp": {"filtered": "sctp"},"m2pa_raw": "00",
"m2pa": {"filtered": "m2pa"},"mtp3_raw": "a","mtp3": {"filtered": "mtp3"},
"sccp_raw": "s",
"sccp": {"filtered": "sccp"}}}

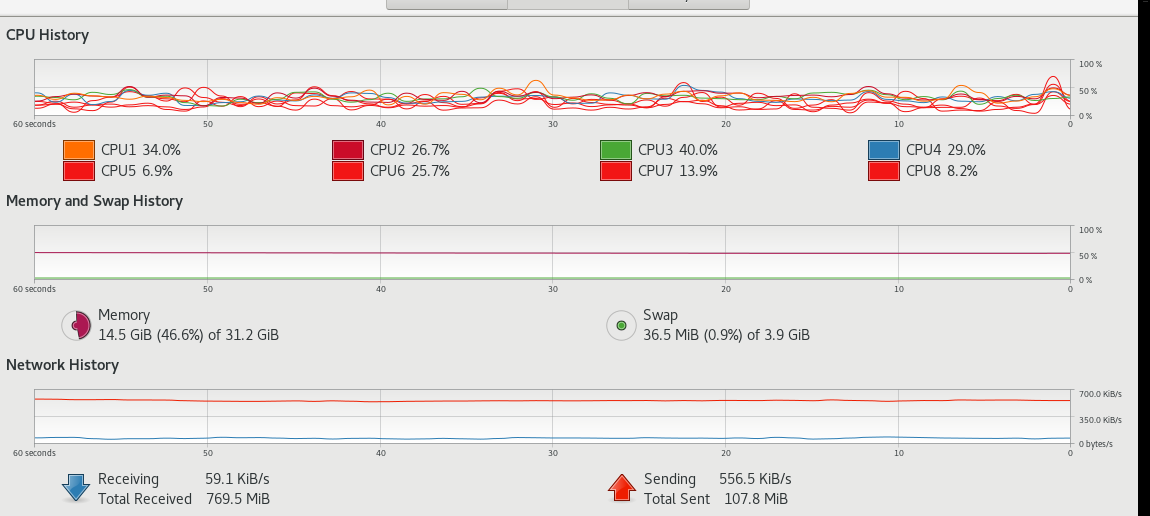
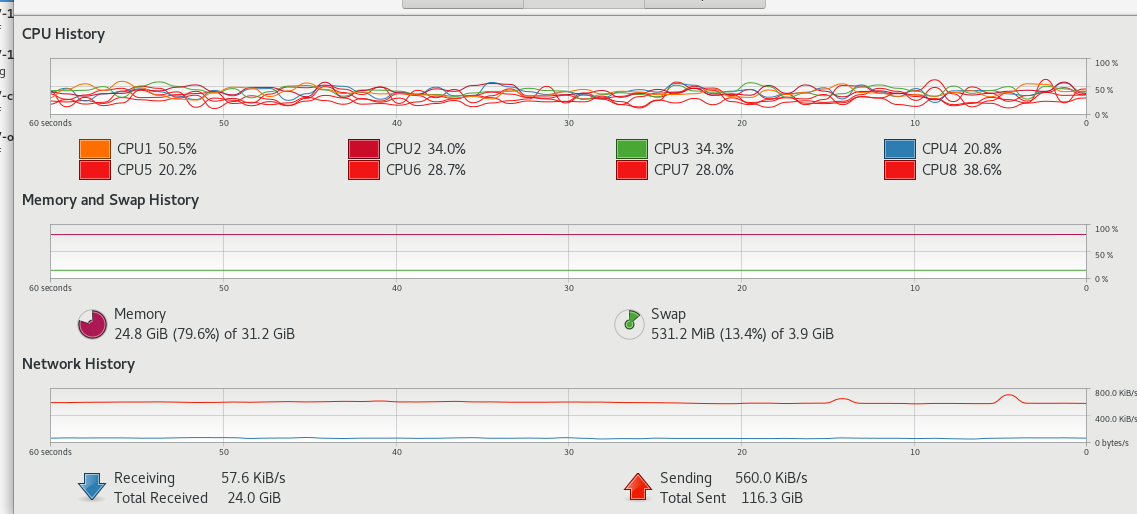
The issue is that the last packet available in Kibana keeps on falling behind the current time even though I see packets being received by ElasticSearch.

Latest document available on Kibana Current date on server

March 27th 2019, 04:15:15.942 Wed Mar 27 09:49:19 CST 2019 5:34 behind
March 28th 2019, 05:17:43.211 Thu Mar 28 12:07:49 CST 2019 6:50 behind
March 28th 2019, 08:06:19.134 Thu Mar 28 15:38:19 CST 2019 7:32 behind

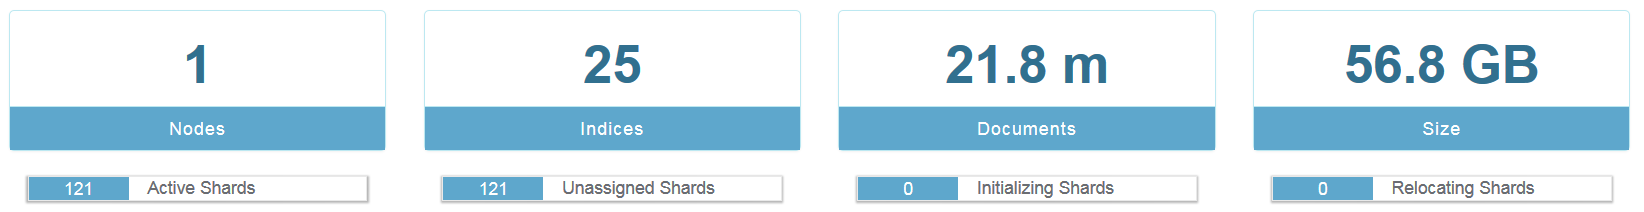
But at the same time I am seeing the number of documents being added to the index increasing:

Documents 1,294,179 1,294,179
Documents 1,296,465 1,296,465

Thanks so much for reaching out.

Ideas?

Maybe check to see if your data is getting into Elasticsearch. For example, see what docs that have a timestamp in the last 5 minutes:

GET packets-2019-04-09/_search
{
    "query": {
            "bool": {
              "filter": [
                  { "range" : { "timestamp" : { "gte": "now-5m" } } }

              ]
            }
    }
}

I tried this:

curl -XPOST 'localhost:9200/GET packets-2019-04-09/_search

{
"query": {
"bool": {
"filter": [
{ "range" : { "timestamp" : { "gte": "now-5m" } } }

          ]
        }
}

}'

But got this error:

curl: (3) [globbing] nested brace in column 62

Ideas as to what I did wrong?

Thanks so much for your insights!

No, you enter the text exactly as shown in the DevTools console:

If you want to use curl you need to format the request differently. Probably easier for you to use DevTools console

Thanks so much for your assistance - I am very new to this and this is extremely helpful advice.

I do not see any hits until I go back to now-8h using the file packets-2019-04-10.

But I do see hits consistently prior to 8h.

To me this seems to indicate that the indexing of the incoming data is occurring is but is requiring more than resources than available in real-time to ingest and thus the processing of the data is getting backed up in the system.

Is this a correct understanding?

This is the current load on the host:

The host does not seem to be overly taxed.

This is the current elasticsearch status:

Any suggestions on how to resolve this lag in getting the documents into kibana?

Thanks again for imparting your wisdom in trying to resolve this issue.

I just determined that the time stamps in the data is in epoch.

This means that the delay is 2 hours not 8 hours so not quite as bad but would still like to make it near real time if possible.

Right, I certainly had a feeling that timezones had at least some type of influence on this situation.

Again, however, it is still unlikely that Elasticsearch is queuing up data for 2 hours. What is the mechanism you are using to connect tshark to Elasticsearch. A few approaches are described in this blog: https://www.elastic.co/blog/analyzing-network-packets-with-wireshark-elasticsearch-and-kibana

What are you doing? Curl? Filebeat? Logstash?

I am piping tshark to curl:

tshark -i ens5 -T ek -l | curl.sh

Any thoughts on how to investigate this further?

This is my elasticsearch summary

Any concerns with this information for the performance of elasticsearch?

What's inside curl.sh?

Here you go:

 #!/bin/bash -
 i=0
 while read line; do
     # process only non empty lines because of older tshark release
     if [ ! -z "$line" ]; then
         c=$(printf '%s\n%s\n' "$c" "$line")
         i=$((i+1))
 
         # curl only every X seconds
         if !((i % 2)) &&  !((SECONDS % 10)) && [[ -v c ]]; then
             #printf '%s\n' "$c"
             printf '%s\n' "$c" | curl -o /dev/null --silent -XPUT http://localhost:9200/_bulk --data-binary @- &
             c=
             i=0
         fi
     fi
 done
 
 #echo $c
 if [[ -v c ]]; then
     printf '%s\n' "$c" | curl -o /dev/null --silent -XPUT http://localhost:9200/_bulk --data-binary @- &
 fi

Maybe allow the shell script to also echo lines to stdout and check the timestamp on some of the records. Inspect the timestamp (decode from epoch time) and see if the value makes sense (i.e. does it match up to "now"?)

Then, as soon as possible, query Elasticsearch for records matching that timestamp exactly. Something like:

GET packets-2019-04-11/_search
{
    "query": {
            "bool": {
              "filter": [
                  { "term" : { "timestamp" :  "1554044059" } } 

              ]
            }
    }
}

(or the ISO-8601 version of the timestamp). Also, do you possibly have 2 timestamps in your index? That is, timestamp and @timestamp?

1 Like

You are da man!

I am sending the curl output into a log file then I am tailing the file.

As soon as I get a record on the screen, I then query that timestamp in Kibana and the record is there.

The time between the record in kibana is still drifting away from the current time though.

Just restarted the service and the time stamps seem to coincide within a few seconds from the server to the packet time being ingested at the start.

This time immediately started drifting apart to reach a few minutes in very short order with the difference still increasing.

Any thoughts as to how to ingest the data more in real-time?

This topic was automatically closed 28 days after the last reply. New replies are no longer allowed.