Kibana version:9.0.3
Elasticsearch version:9.0.3
APM Server version:9.0.3
APM Agent language and version:1.49.0
Browser version: Chrome Version 140.0.7339.128 (Official Build) (64-bit)
Original install method (e.g. download page, yum, deb, from source, etc.) and version: download page
Fresh install or upgraded from other version?
Is there anything special in your setup? I’m running both standalone APM server (on the same host running Elasticsearch and Kibana {WINDOWS} ) on port 8200, and another fleet server (LINUX) with APM integration added on port 8201, both secured with my corp. certificates
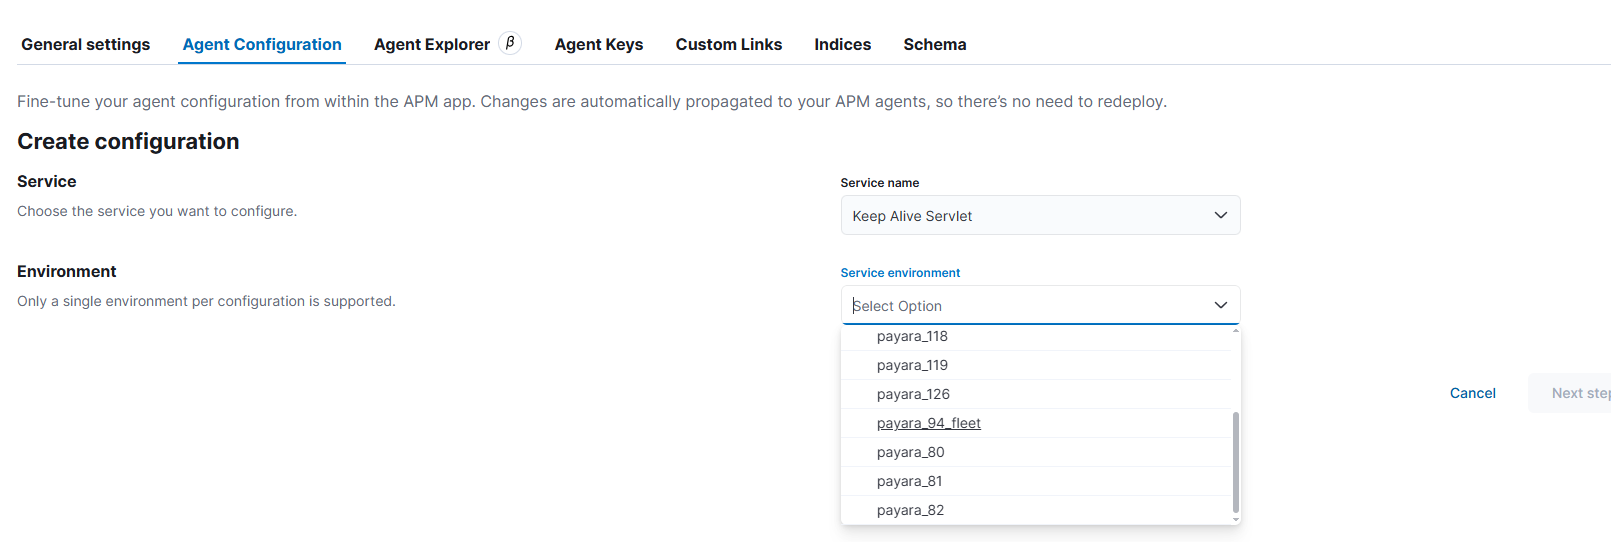
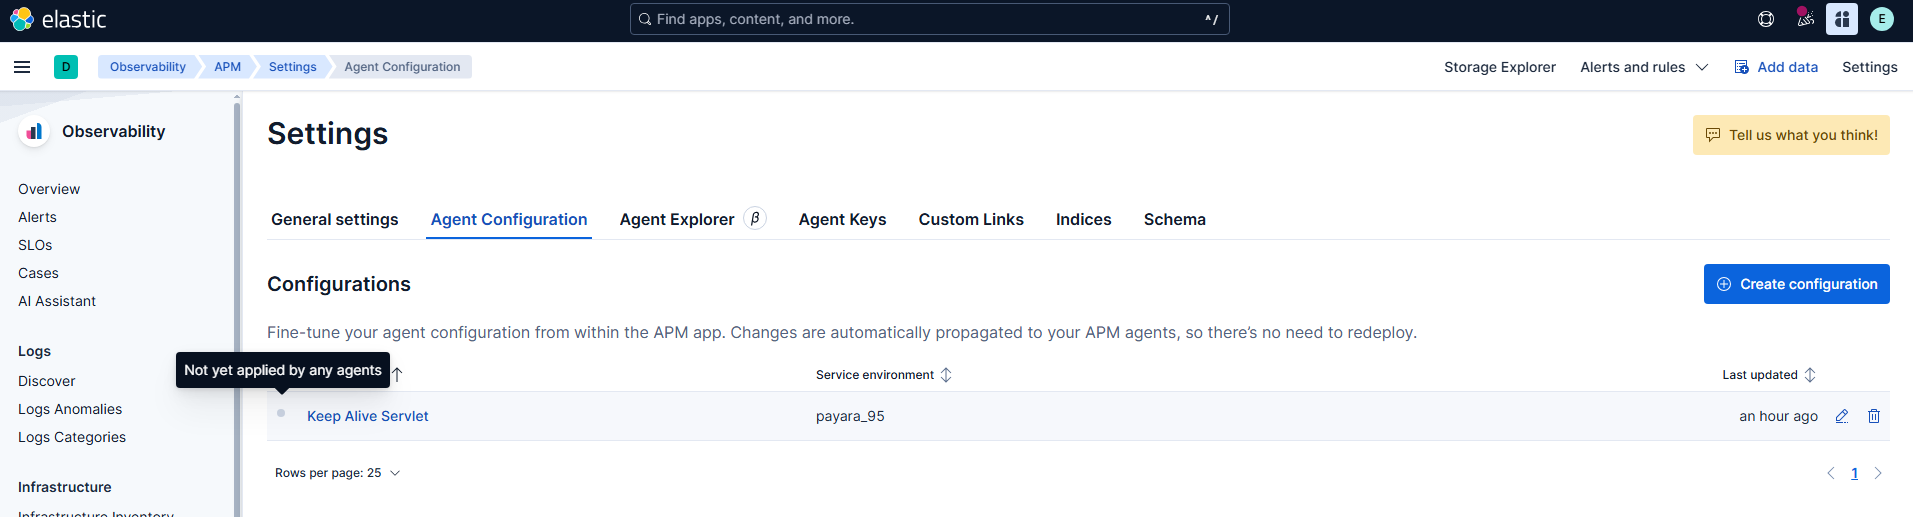
Description of the problem including expected versus actual behavior. Please include screenshots (if relevant):No matter how many times I try, APM central configuration is not passed on to the agent. UI says “Not yet applied by any agents” and the agent log is pulling empty APM configuration.

Steps to reproduce:
- push any transaction from APM agent onto Elasticsearch
- disable logging or header captures from APM central configuration
- perform the same transaction again and observe (no change)
Errors in browser console (if relevant):none
Provide logs and/or server output (if relevant): APM agent log
2025-09-24 10:37:15,882 [main] INFO  co.elastic.apm.agent.util.JmxUtils - Found JVM-specific OperatingSystemMXBean interface: com.sun.management.OperatingSystemMXBean
2025-09-24 10:37:15,898 [main] INFO  co.elastic.apm.agent.util.JmxUtils - Found JVM-specific ThreadMXBean interface: com.sun.management.ThreadMXBean
2025-09-24 10:37:15,919 [main] INFO  co.elastic.apm.agent.configuration.StartupInfo - Starting Elastic APM 1.49.0 as glassfish-application on Java 17.0.12 Runtime version: 17.0.12+7-LTS VM version: 17.0.12+7-LTS (Red Hat, Inc.) Windows Server 2019 10.0
2025-09-24 10:37:15,920 [main] INFO  co.elastic.apm.agent.configuration.StartupInfo - environment: 'payara_95' (source: Java System Properties)
2025-09-24 10:37:15,921 [main] INFO  co.elastic.apm.agent.configuration.StartupInfo - capture_body: 'ALL' (source: Java System Properties)
2025-09-24 10:37:15,921 [main] INFO  co.elastic.apm.agent.configuration.StartupInfo - trace_methods: 'com.ist.stc.sms.buslogic.generators.*#processReport' (source: Java System Properties)
2025-09-24 10:37:15,921 [main] INFO  co.elastic.apm.agent.configuration.StartupInfo - server_url: 'https://10.21.144.84:8201' (source: Java System Properties)
2025-09-24 10:37:15,922 [main] INFO  co.elastic.apm.agent.configuration.StartupInfo - application_packages: 'com' (source: Java System Properties)
2025-09-24 10:37:15,922 [main] INFO  co.elastic.apm.agent.configuration.StartupInfo - log_file: 'D:/app-server-payara6/glassfish/domains/domain1/log/KibanaLogs/elastic-apm.log' (source: Java System Properties)
2025-09-24 10:37:17,974 [main] INFO  co.elastic.apm.agent.impl.ElasticApmTracer - Tracer switched to RUNNING state
2025-09-24 10:37:18,740 [elastic-apm-server-healthcheck] INFO  co.elastic.apm.agent.report.ApmServerHealthChecker - Elastic APM server is available: {  "build_date": "2025-06-18T16:03:08Z",  "build_sha": "c60a82e53092e3c579a00205a7af57eeea08144a",  "publish_ready": true,  "version": "9.0.3"}
2025-09-24 10:37:18,771 [elastic-apm-remote-config-poller] WARN  org.stagemonitor.configuration.ConfigurationOption - Error in Java System Properties: Can't convert always to TraceContinuationStrategy Default value 'CONTINUE' for 'trace_continuation_strategy' will be applied.
2025-09-24 10:37:18,771 [elastic-apm-remote-config-poller] INFO  co.elastic.apm.agent.configuration.ApmServerConfigurationSource - Received new configuration from APM Server: {}
2025-09-24 10:37:33,906 [RunLevelControllerThread-1758699443498] INFO  co.elastic.apm.agent.servlet.ServletVersionInstrumentation - Servlet container info = Payara Server 6.2023.12 #badassfish
2025-09-24 10:37:35,177 [RunLevelControllerThread-1758699443498] INFO  co.elastic.apm.agent.servlet.ServletVersionInstrumentation - Servlet container info = Payara Server 6.2023.12 #badassfish
2025-09-24 10:37:36,160 [RunLevelControllerThread-1758699443498] INFO  co.elastic.apm.agent.servlet.ServletVersionInstrumentation - Servlet container info = Payara Server 6.2023.12 #badassfish
2025-09-24 10:37:45,767 [elastic-apm-configuration-reloader] WARN  org.stagemonitor.configuration.ConfigurationOption - Error in Java System Properties: Can't convert always to TraceContinuationStrategy Default value 'CONTINUE' for 'trace_continuation_strategy' will be applied.
2025-09-24 10:38:15,767 [elastic-apm-configuration-reloader] WARN  org.stagemonitor.configuration.ConfigurationOption - Error in Java System Properties: Can't convert always to TraceContinuationStrategy Default value 'CONTINUE' for 'trace_continuation_strategy' will be applied.
2025-09-24 10:38:45,766 [elastic-apm-configuration-reloader] WARN  org.stagemonitor.configuration.ConfigurationOption - Error in Java System Properties: Can't convert always to TraceContinuationStrategy Default value 'CONTINUE' for 'trace_continuation_strategy' will be applied.
2025-09-24 10:39:15,767 [elastic-apm-configuration-reloader] WARN  org.stagemonitor.configuration.ConfigurationOption - Error in Java System Properties: Can't convert always to TraceContinuationStrategy Default value 'CONTINUE' for 'trace_continuation_strategy' will be applied.
2025-09-24 10:39:45,766 [elastic-apm-configuration-reloader] WARN  org.stagemonitor.configuration.ConfigurationOption - Error in Java System Properties: Can't convert always to TraceContinuationStrategy Default value 'CONTINUE' for 'trace_continuation_strategy' will be applied.