Hi team, I am newbie using apm, using apm-server and apm-agent php,
apm-server 7.12
apm-aget-php v1.3
The problem here is there are some fields that don't exist in the index, for example: http.response.status_code and when I tried to view errors in the APM dashboard there is no data

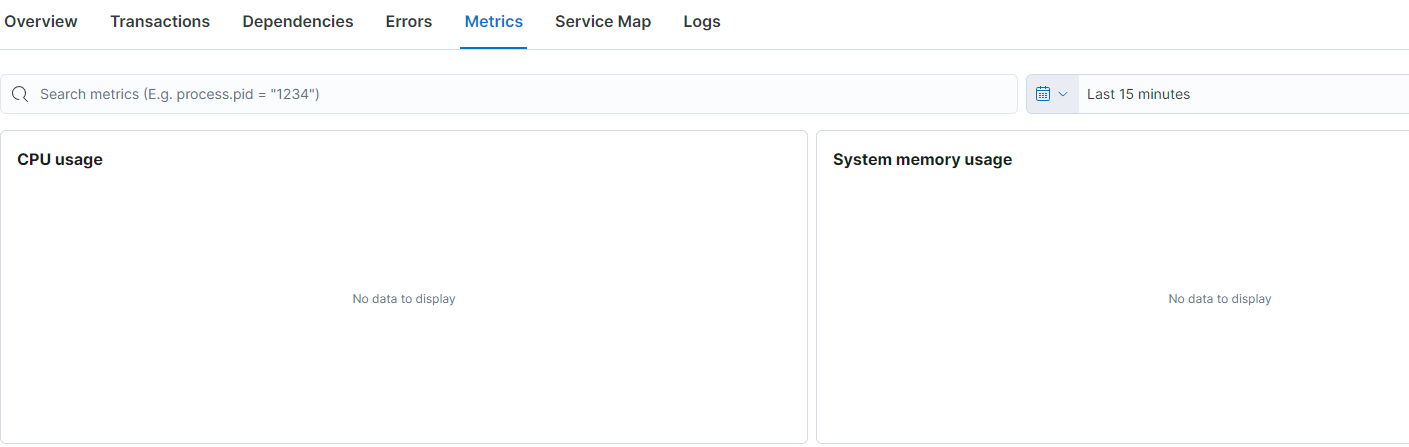
And this for metrics
I am trying to reproduce errors in the application to test but looks like there are fields missing
For example:

I am getting errors 5xx.
But looks like I am missing a lot of data. If I check the Transaction details I see this.

This is the configuration that I have for apm-server and apm-agent-php
apm-server.yaml
  apmConfig:
    apm-server.yml: |
      apm-server:
        host: "0.0.0.0:8200"
        apm-server.rum.enabled: true
        apm-server.rum.allow_origins: ['*']
      queue: {}
      output.elasticsearch:
        username: '${ELASTICSEARCH_USERNAME}'
        password: '${ELASTICSEARCH_PASSWORD}'
        protocol: https
        hosts: ["elastic-client-${ENVIRONMENT}.${ENVIRONMENT}.example.com:443"]
and for
apm-agent-php (php.ini)
    [elastic]
    extension=elastic_apm.so
    elastic_apm.bootstrap_php_part_file = /apm-agent-php-1.3.1/src/bootstrap_php_part.php
    elastic_apm.server_url = http://apm-server.kube-system.svc.cluster.local:8200
    elastic_apm.service_name = "Litespeed Service"
My question here is, there are some missing configurations here? I think is default but not sure and I can't find examples of configurations in the documentation, I am using Kubernetes, so the apm-server is a pod and the apm-php-agent was added in our application Dockerfile using the official helm-chart.
Regards!
Regards!