APM metrics in Kibana not showing when collected with metricbeat

Kibana version: 7.15.2

Elasticsearch version: 7.15.2

APM Server version: 7.15.2

APM Agent language and version: Not using APM agent

Original install method: Elastic cloud

Is there anything special in your setup? I am collecting traces data using opentelemetry and some metrics with metricbeat.

Description of the problem including expected versus actual behavior. Please include screenshots (if relevant): In the APM part of Kibana, I can see my nodejs application with its spans, but I don't see any metrics.

My metricbeat data is sent to the metricbeat-* index, so I made sure to change the "Metrics indices" setting.

image

I suspect that the graph don't show anything because they don't find any data for the service or because the graph are using specific fields names that I don't have. What does the APM graphs need to show this information?
I suppose it needs data with at least the following fields:

  • service.name
  • service.node.name
  • service.environment
    and any other fields the graphs are trying to plot.

So I tried to add all the fields from this page: Metrics | APM Node.js Agent Reference [3.x] | Elastic but I still don't see anything.

Any suggestion?

Note: I have a similar problem with java, except that I receive some metrics from the opentelemetry collector and they do show properly. But I am missing CPU usage, system memory usage and thread count.

Hello again Clément -- that's a great question. In response, I've got a follow up question for you, and then some background information that might help.

Question: You mentioned setting the Metrics indices value -- what section of the UI did you set this in?

Background:

APM Agent Metrics: The metrics charts you're looking at normally pull data from the apm-[version]-metric-* indices. These indices are populated by the traditional (not OTel) Node.js Agent. The data needs to be in a very specific format -- here's the result of a GET apm-7.15.*-metric-*/_search {} query into a system that's reporting metrics via the Elastic Node.js Agent. It's goes beyond just names.

MetricBeat: Despite using the name "metrics", MetricBeat is a separate feature of Elastic's platform that's more about getting generic metrics into an Elastic Instance. There's not (at least to my knowledge?) a quick/easy/supported way to transform these metrics into an APM compatible format. The common use case is that you'd chart the data in the metricbeat indicies via a custom Dashboard -> Visualize Library.

Does that make sense @ccontini and/or lead to any follow-up questions? Or did I miss the mark in some way?

Hello @alanstorm,

I'll start by answering your question.
The setting I am talking about is found in the APM section of Kibana. At the top you have a "settings" button you can click and then you can move to the "Indices" tab.


The last parameter is for "Metrics indices" which by default looks like this:

Now regarding your answer, I understand that metricbeat is a different feature than APM but I expected the stored documents to actually be quite similar in the end, when it comes to metrics.
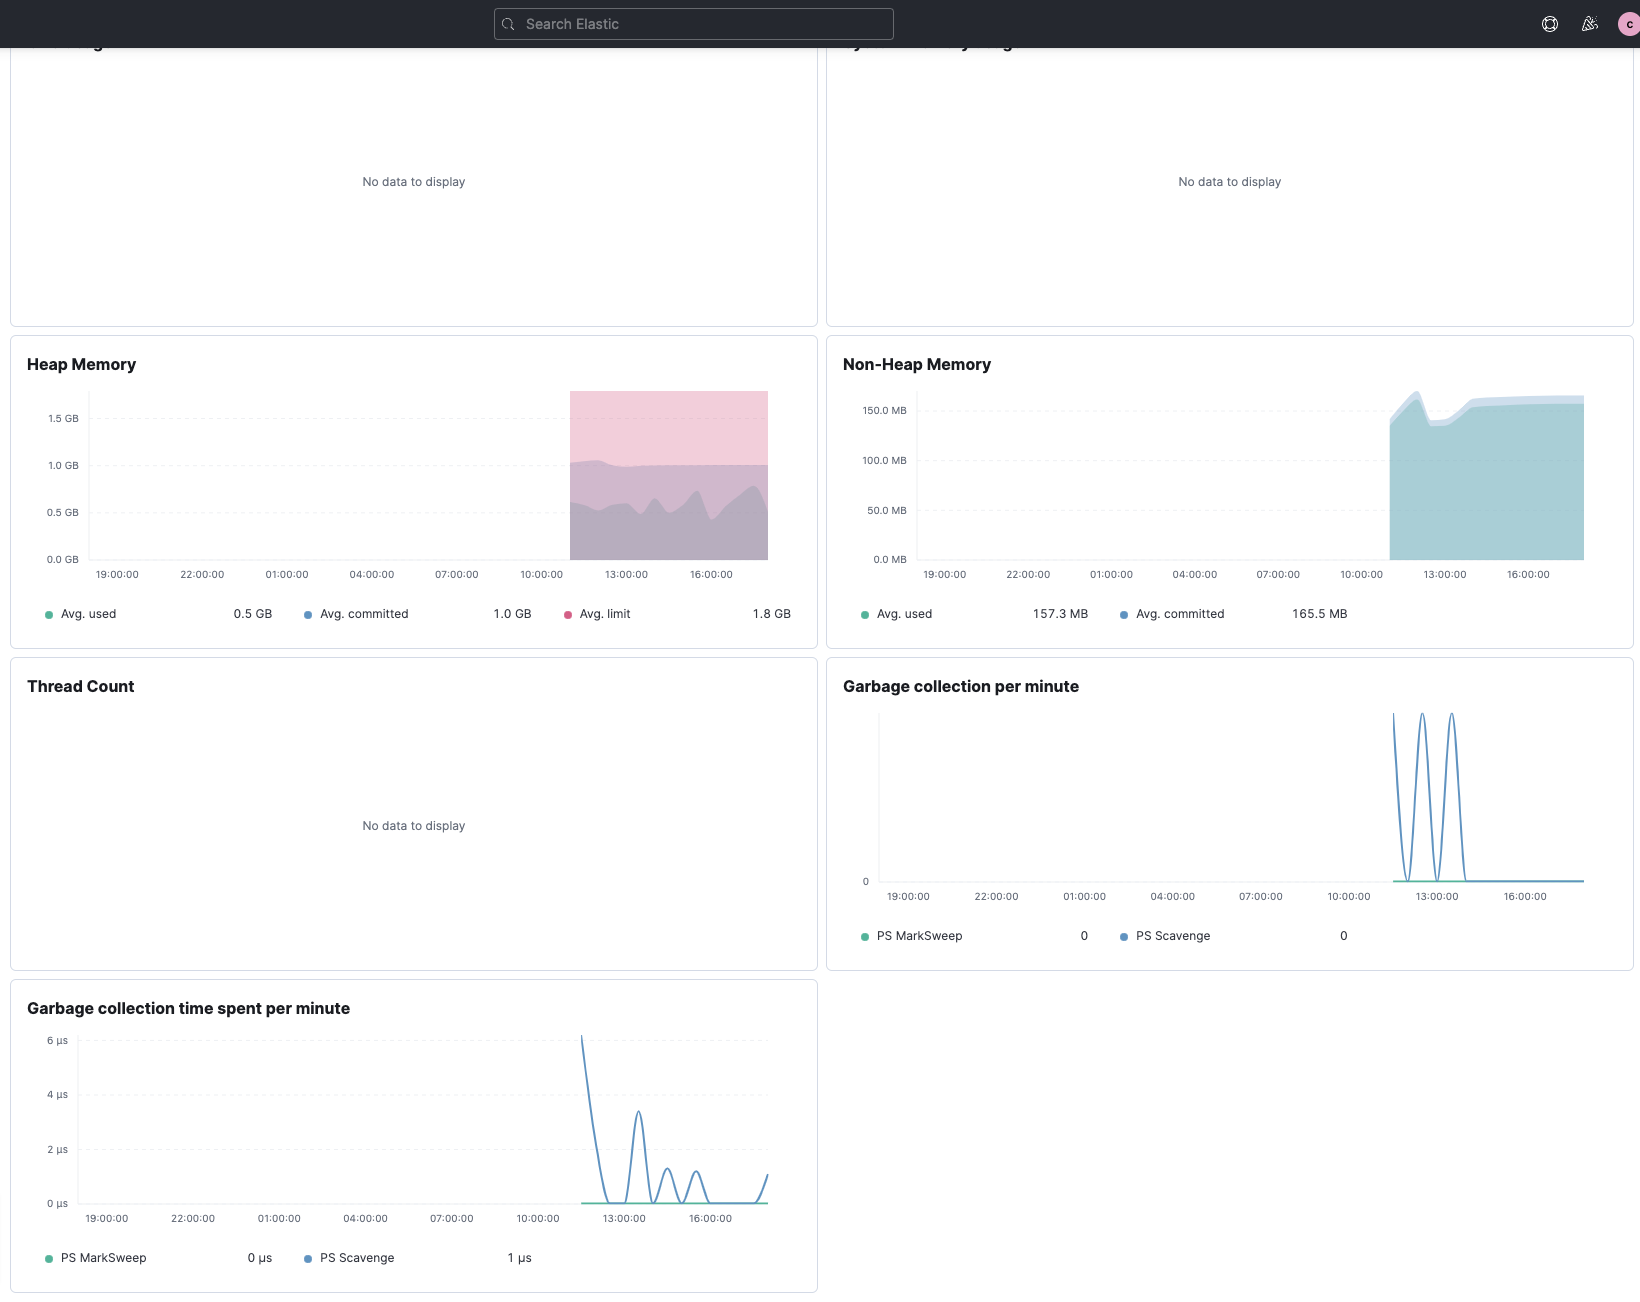
To support my claim, I actually took a look at metrics data, in the apm-* index, populated by the otel-collector to see what they look like. Here is an example of some metrics about a jvm that I do see properly in the graphs on the APM page (or maybe I am completely wrong and that data is not used if the graph?). I selected a document that reports a field that is documented here: Metrics | APM Java Agent Reference [1.x] | Elastic.

{
  "_index": "apm-7.15.2-metric-000001",
  "_type": "_doc",
  "_id": "v227bH0BroH8caugumsY",
  "_version": 1,
  "_score": 1,
  "_source": {
    "jvm.memory.heap.used": 782537896,
    "jvm.memory.non_heap.used": 173870408,
    "agent": {
      "name": "opentelemetry/java",
      "version": "1.6.0"
    },
    "process": {
      "pid": 28559,
      "command_line": "***",
      "executable": "***"
    },
    "jvm.memory.heap.max": 1791492096,
    "jvm.memory.non_heap.committed": 183042048,
    "processor": {
      "name": "metric",
      "event": "metric"
    },
    "labels": {
      "process_runtime_description": "Red Hat, Inc. OpenJDK 64-Bit Server VM 25.302-b08",
      "deployment_name": "stage",
      "service_namespace": "CEP",
      "telemetry_auto_version": "1.6.0"
    },
    "metricset.name": "app",
    "observer": {
      "hostname": "2794cd8d5fad",
      "name": "instance-0000000003",
      "id": "debcf0c6-5cdc-47e0-a5c9-bc37927926aa",
      "ephemeral_id": "97c2eab3-fd18-4ccf-b6ae-674c71f427c3",
      "type": "apm-server",
      "version": "7.15.2",
      "version_major": 7
    },
    "@timestamp": "2021-11-29T17:26:19.463Z",
    "ecs": {
      "version": "1.11.0"
    },
    "service": {
      "node": {
        "name": "ip-172-31-26-141.ec2.internal"
      },
      "environment": "stage-use1",
      "name": "wise-cep",
      "runtime": {
        "name": "OpenJDK Runtime Environment",
        "version": "1.8.0_302-b08"
      },
      "language": {
        "name": "java"
      }
    },
    "jvm.memory.heap.committed": 1038614528,
    "host": {
      "hostname": "ip-172-31-26-141.ec2.internal",
      "os": {
        "type": "linux",
        "platform": "linux",
        "full": "Linux 4.14.248-129.473.amzn1.x86_64"
      },
      "name": "ip-172-31-26-141.ec2.internal",
      "architecture": "amd64"
    },
    "event": {
      "ingested": "2021-11-29T17:26:21.972599037Z"
    }
  },
  "fields": {
    "process.command_line.text": [
      "***"
    ],
    "jvm.memory.heap.used": [
      782537920
    ],
    "host.os.full.text": [
      "Linux 4.14.248-129.473.amzn1.x86_64"
    ],
    "labels.process_runtime_description": [
      "Red Hat, Inc. OpenJDK 64-Bit Server VM 25.302-b08"
    ],
    "jvm.memory.non_heap.committed": [
      183042048
    ],
    "observer.name": [
      "instance-0000000003"
    ],
    "host.os.full": [
      "Linux 4.14.248-129.473.amzn1.x86_64"
    ],
    "service.node.name": [
      "ip-172-31-26-141.ec2.internal"
    ],
    "host.hostname": [
      "ip-172-31-26-141.ec2.internal"
    ],
    "process.pid": [
      28559
    ],
    "service.language.name": [
      "java"
    ],
    "labels.telemetry_auto_version": [
      "1.6.0"
    ],
    "process.executable.text": [
      "***"
    ],
    "processor.event": [
      "metric"
    ],
    "jvm.memory.heap.committed": [
      1038614530
    ],
    "agent.name": [
      "opentelemetry/java"
    ],
    "host.name": [
      "ip-172-31-26-141.ec2.internal"
    ],
    "process.executable": [
      "/usr/lib/jvm/java-1.8.0-openjdk-1.8.0.302.b08-0.67.amzn1.x86_64/jre:bin:java"
    ],
    "service.environment": [
      "stage-use1"
    ],
    "jvm.memory.non_heap.used": [
      173870400
    ],
    "jvm.memory.heap.max": [
      1791492100
    ],
    "host.os.type": [
      "linux"
    ],
    "service.name": [
      "wise-cep"
    ],
    "service.runtime.name": [
      "OpenJDK Runtime Environment"
    ],
    "labels.deployment_name": [
      "stage"
    ],
    "processor.name": [
      "metric"
    ],
    "service.runtime.version": [
      "1.8.0_302-b08"
    ],
    "observer.version_major": [
      7
    ],
    "observer.hostname": [
      "2794cd8d5fad"
    ],
    "host.architecture": [
      "amd64"
    ],
    "metricset.name": [
      "app"
    ],
    "observer.id": [
      "debcf0c6-5cdc-47e0-a5c9-bc37927926aa"
    ],
    "event.ingested": [
      "2021-11-29T17:26:21.972Z"
    ],
    "@timestamp": [
      "2021-11-29T17:26:19.463Z"
    ],
    "observer.ephemeral_id": [
      "97c2eab3-fd18-4ccf-b6ae-674c71f427c3"
    ],
    "observer.version": [
      "7.15.2"
    ],
    "host.os.platform": [
      "linux"
    ],
    "ecs.version": [
      "1.11.0"
    ],
    "observer.type": [
      "apm-server"
    ],
    "process.command_line": [
      "***"
    ],
    "agent.version": [
      "1.6.0"
    ],
    "labels.service_namespace": [
      "CEP"
    ]
  }
}

This makes me think that there isn't anything inherently different between metrics produced by otel, apm or metricbeat. However, I suspect that the APM dashboards expect specific fields for specific types of systems. That's why I was wondering if this is documented anywhere, since I don't think I can see the definition of the dashboards that are on the APM page.

Another solution would be to "reverse engineer" this, by instrumenting a node js application using the APM agent from elastic and see what the metrics documents look like. But I would rather read some documentation instead.

Once I know what the dashboards expect, I am confident I could generate the right type of document with metricbeat.

Does that make sense?

That's makes sense @ccontini. What you say here

This makes me think that there isn't anything inherently different between metrics produced by otel, apm or metricbeat. However, I suspect that the APM dashboards expect specific fields for specific types of systems

is more or less correct. Metrics are fundamentally "a string identifier" paired with "a value". The differences between the various systems will be in what format the JSON in the index takes, what the value means (ex. a number might be milliseconds in one system but seconds in another), and which string identifiers are queried for by a UI like Kibana.

I don't think we have this information explicitly documented anywhere. I have questions pending with the various teams responsible and I will update this thread if new information becomes available, but I believe this is a case where the source code that's doing this work is the documentation.

If you end up going the reverse engineering route, here's a few other links that might be of interest. Not the docs you asked for, but potentially interesting none-the-less.

On the Kibana side of thing, I believe the code that fetches the data for the metrics charts begins here (memory)

and here (cpu)

On the Node.js Agent/APM Server side of things, we do have a JSON schema that defines the intake API -- that is, it defines what APM Server accepts

Finally -- for what it's worth you're not the only person who's noticed that Metricbeat metrics don't appear in the metrics. I know there are teams looking at the best way to improve this experience long term.

I hope that helps, and if you have more specific questions you know where to find us :slight_smile:

@ccontini A few final links with some information on querying for metrics that might help you out.

and then an APM Server issue discussing the need for some sort of schema, validator, or transformer for these events: model: create a specification for valid event docs · Issue #4410 · elastic/apm-server · GitHub (confirming that the schemas you're looking for don't exist)

Thank you @alanstorm, I will take a look at the documentation you provided and let you know if I can make it work!

This topic was automatically closed 20 days after the last reply. New replies are no longer allowed.