Barracuda Cloudgen Integration / Agent possibly broken?

Good Morning Everyone,

I have the following situation:

  • The Barracuda firewall is configured as described here
  • The integration is configured as per default values
    • The agent is enrolled with the right integration policy
  • I am receiving data from the firewall on the machine where the agent is installed, verified with sudo tcpdump -A -s 0 'dst port 5044'
  • The Agent appears to be healthy from kibana and on the agent host

 /opt/Elastic/Agent/elastic-agent status
┌─ fleet
│  └─ status: (HEALTHY) Connected
└─ elastic-agent
   └─ status: (HEALTHY) Running
  • Checking with sudo lsof -i :5044 we can see that the agent is listening on the right port
lsof -i :5044
COMMAND    PID USER   FD   TYPE DEVICE SIZE/OFF NODE NAME
agentbeat 2782 root    6u  IPv4 137677      0t0  TCP localhost:5044 (LISTEN)
  • There is communication between the agent and Elasticsearch as I can sort by agent.id and see its logs (but never data from the firewall)

(there was an image here, but I cannot have more than one image per post as a new user)

  • BUT, there are no barracuda related logs in Elasticsearch / Kibana

I cannot undestand where it is going wrong as everything appears to be healthy and running, but very clearly is not.

Logs show no error, besides a minor warning that files that filebeat is monitoring are too small to be ingested.

For testing purposes, I configured tried configuring Logstash manually and data was being accepted and forwarded to Elasticsearch

Agent is communicating with elasticsearch

logs of the agent (set to debug)

It seems analogous to this issue here Elastic agent Does not receive traffic, but it reaches the Linux server - Elastic Stack / Kibana - Discuss the Elastic Stack but it wasn't solved either

Can you share your integration configuration, please...

What Integration? Version? The actual Integration settings.

Can you open up the time frame on the Discover to 30 days ago to 24 Hours in the Future (yup timezone issues can cause this)

Can you go to Stack Management -> Index Management -> Data Streams and see if there is a barracuda data stream?

Go to Kibana -> Dev Tools run this show results

GET _cat/indices/*bar*?v

You can bump up the Agent Logs to Debug on the agent logs screen

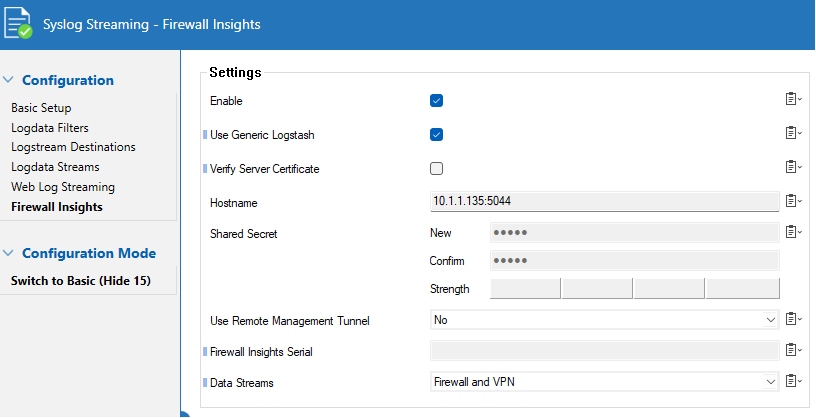
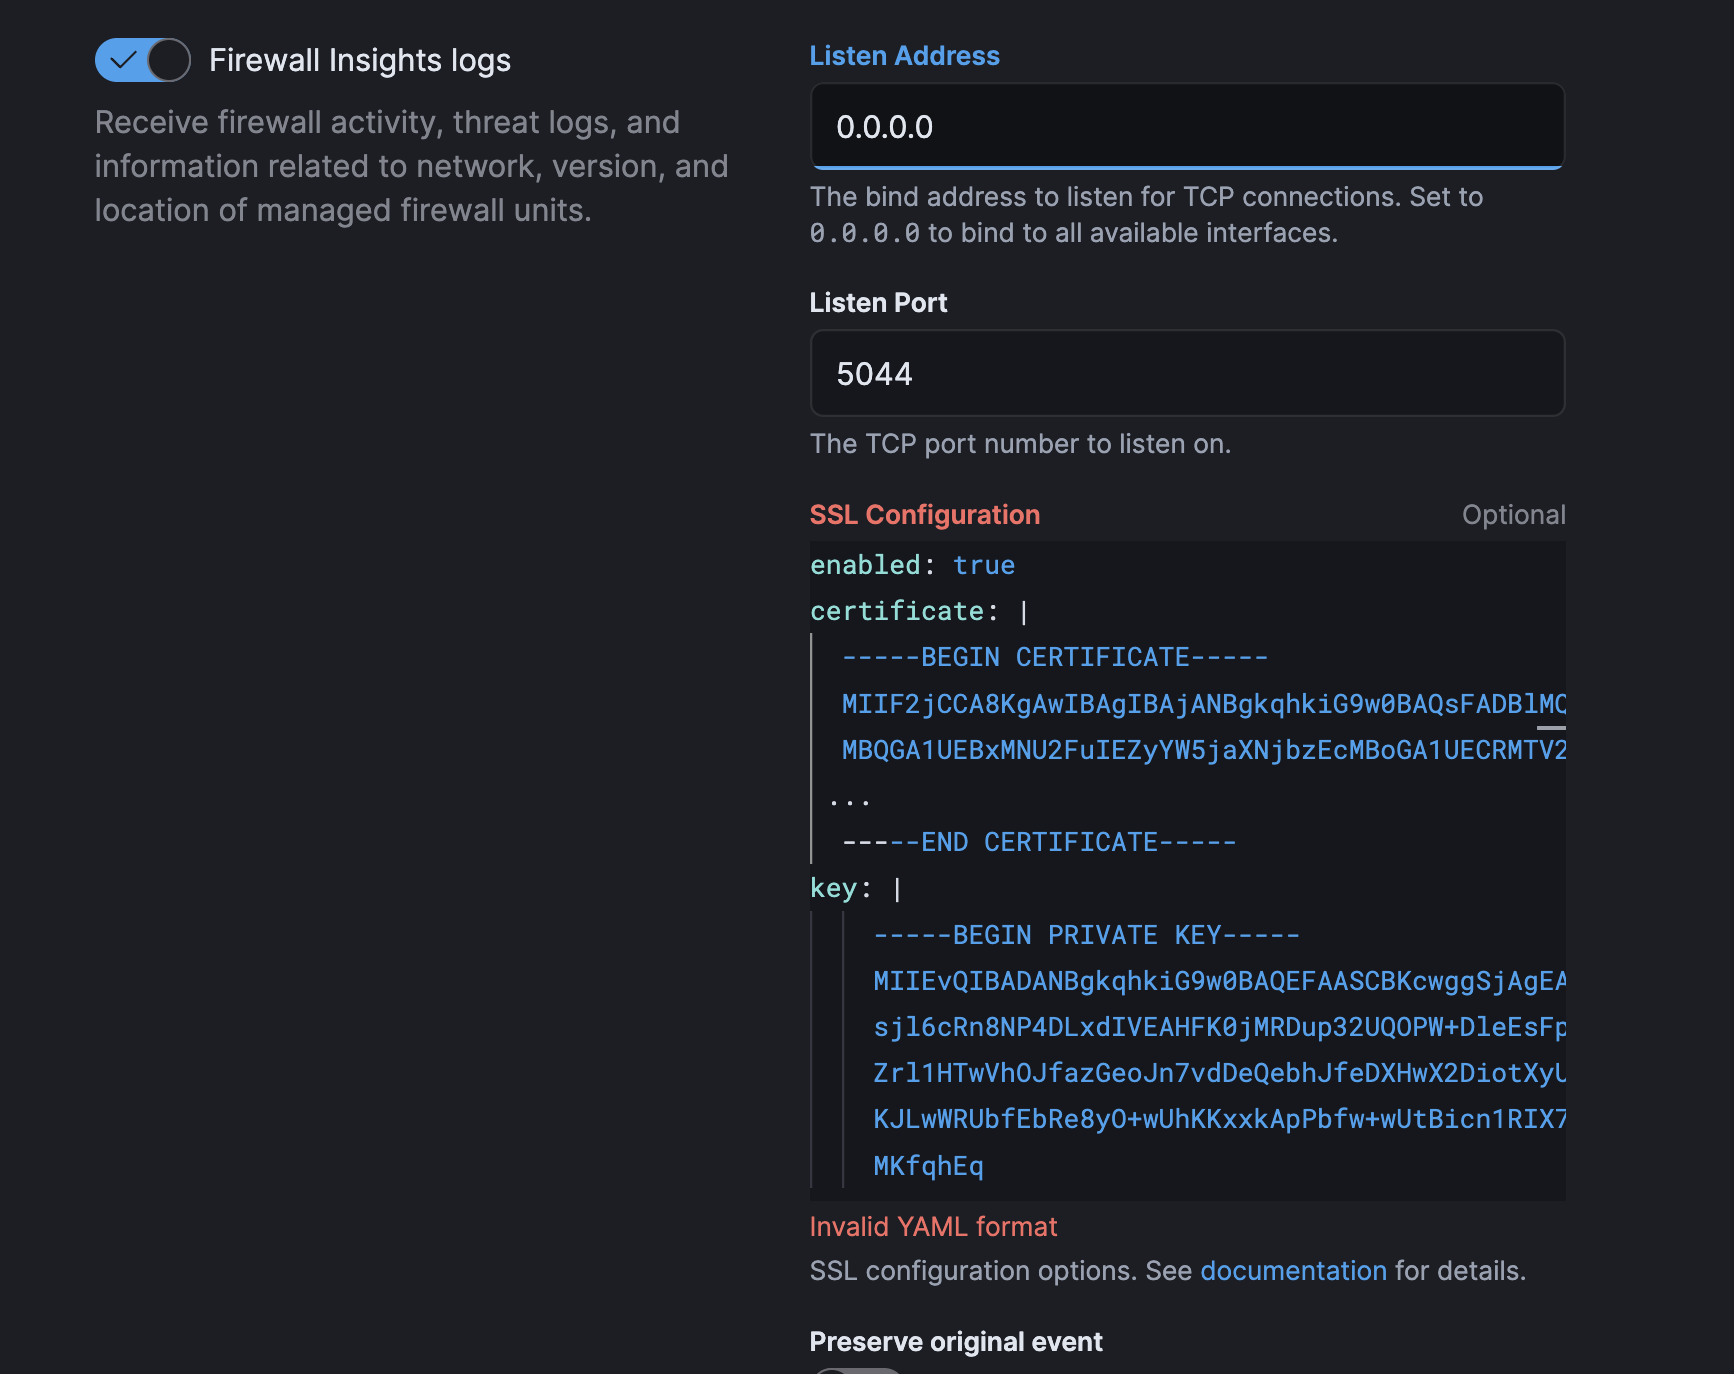
My integration version is v1.6.0 and settings can be seen in the first screenshot (just default settings). I have tried changing the “listen address” to 0.0.0.0 and the IP of the interface / host to no avail.

Similarly putting the line enabled: false in the SSL yaml configuration also didn’ change anything.

Switching the time range from 30 days ago - 24 hours from now, did not make any barracuda logs surface.

Currently there is no Barracuda Data stream present under Stack Management → Index Management → Data Streams. (There is under index templates, I guess verifying that the integration is installed)

Running GET _cat/indices/*bar*?v only returns the following line

health status index uuid pri rep docs.count docs.deleted store.size pri.store.size dataset.size

I've set my logs to debug, I cannot see error messages or other indications of what's going wrong. Here an extract of them https://paste.opensuse.org/pastes/53c14d1fe99b

Thank you for looking at my issue

EDIT: Here my agent policy openSUSE Paste

This might be of interest to the elastic team, as I just consulted with some industry peers in my area and the reply I got was "the barracuda cloudgen integration doesn't work, you need to use logstash". Weird bug.

Perhaps you mean 1.16.0 which is the latest... looks like it when I look at the config.

You would definitely need to bind to 0.0.0.0 OR the incoming network available IP locallhost will not work.

Can you try that and share the logs again...

Any more details you can provide on this?

@andrewkroh .... Any ideas?

You need to use 0.0.0.0 in the configuration or the private ip address of the VM that is reachable by other servers, localhost will not work.

What was the configuration pipeline that you used on Logstash? Can you also share a sample of the messages that are being received?

Can you share a screenshot of the configuration Barracuda side?

Yes it was a typo.

It wasn't working with 0.0.0.0 either. Here an extract of the logs with 0.0.0.0 as listen address set (logs here as text )

Not really, it is the literal quote I got.

Again, thank you for your time on this.

Thank you for the suggestion, in my experimentation it was set to 0.0.0.0 most of the time, and have proceeded to put it as 0.0.0.0 again. Sadly it did not fix it.

This was the configuration pipeline on logstash (which was working)

Firewall is configured like this (as per integration documentation)

Just the tcpdump?

Thank you as well for taking your time with this.

You need to leave it as 0.0.0.0 to even be able to troubleshoot, if you set it as localhost it will only receive requests generated locally, so it needs to be set as 0.0.0.0.

What does your input configuration looks like, specially the SSL configuration? Can you share a screenshot of your configuration like this?

I do not have Barracuda, but it looks like that it will send logs using SSL, so if your input SSL configuration is not correct it may not listen for SSL connections and just discard it.

No, a sample message from the Logstash output if you have a stdout output configured, it will be present on the log file.

Ahhhh Now looking at the docs / sample yes looks like it is definitely SSL so you need to enable SSL and Provide Cert

enabled: true
certificate: |
  -----BEGIN CERTIFICATE-----
  MIIF2jCCA8KgAwIBAgIBAjANBgkqhkiG9w0BAQsFADBlMQswCQYDVQQGEwJVUzEW
  MBQGA1UEBxMNU2FuIEZyYW5jaXNjbzEcMBoGA1UECRMTV2VzdCBFbCBDYW1pbm8g
  UmVhbDEOMAwGA1UEERMFOTQwNDAxEDAOBgNVBAoTB0VsYXN0aWMwHhcNMjMxMDMw
  MTkyMzU4WhcNMjMxMDMxMTkyMzU4WjB2MQswCQYDVQQGEwJVUzEWMBQGA1UEBxMN
  U2FuIEZyYW5jaXNjbzEcMBoGA1UECRMTV2VzdCBFbCBDYW
....
  -----END CERTIFICATE-----
key: |
    -----BEGIN PRIVATE KEY-----
    MIIEvQIBADANBgkqhkiG9w0BAQEFAASCBKcwggSjAgEAAoIBAQDXHufGPycpCOfI
    sjl6cRn8NP4DLxdIVEAHFK0jMRDup32UQOPW+DleEsFpgN9/ebi9ngdjQfMvKnUP
    Zrl1HTwVhOJfazGeoJn7vdDeQebhJfeDXHwX2DiotXyUPYu1ioU45UZDAoAZFj5F
    KJLwWRUbfEbRe8yO+wUhKKxxkApPbfw+wUtBicn1RIX7W1nBRABt1UXKDIRe5FM2
    MKfqhEq
...
    -----END PRIVATE KEY-----

1 Like

Oha. This was the solution. As I am not the only one experiencing this problem, I think it might be smart to explicit it on the integrations page. I would have not found this configuration option without your help.

Thanks to everyone involved in this thread.

1 Like

Yeah, unfortunately this is a long time issue regarding documentation, a lot of things do not have enough examples, some have none.

Regarding integrations, I think there are zero examples on how to configure the integrations, some are pretty straigh forward, but there are some integrations that have some requirements in the configuration that is not clear in the documentation.

As a user with a support contract I've been mentioning this on every interation I have with Elastic, that the lack of documentation is a big problem.

1 Like