Bulk indexing causes management threadpool queue to skyrocket

After bulk indexing for 10 minutes on a 7.4.1 cluster, it will suddenly become completely unresponsive to any cluster state requests.
It still index's and still responds to queries, but the cluster state itself is unresponsive. After a while nodes will start to leave the cluster if it's left in this state, however, we find if we stop ingestion, it will recover.

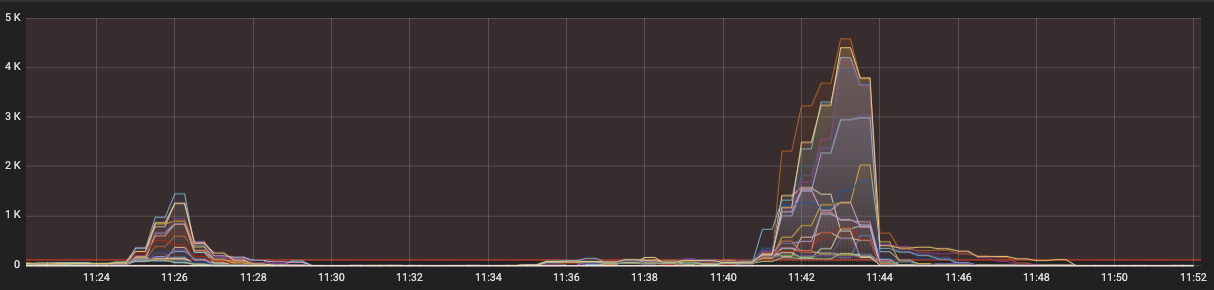
This is the sudden increase in CPU we see across all data nodes in the cluster:

This is the management thread pool queue count across the cluster. Note it skyrockets once this starts.

Once we stop ingestion, we find we can go the Data Node with the largest queue and restart ES on it and we are back in business.

Big questions: Why doesn't ES rate limit bulk ingestion? We get no rejections, no 429's, nothing on the write queues. We know these clusters can ingest a lot more, on ES 2 we are doing 50k docs per second on the same hardware and 7.4.1 seems to fall over at 25k per second.

How can we get these management cluster state queues to relax?

I should mention that the CPU/management queue drops are after we turn off all ingestion.

As I mentioned in another thread, it would be useful to see what these nodes are so busy doing. I'd try the nodes hot threads API: GET /_nodes/hot_threads?threads=99999. However, this runs on the management threadpool, so if that threadpool is where the problem is then it won't work. If so, please use jmap to grab a thread dump directly from the JVM. Also, of course, if there are any messages in the logs from the time of the problem then they would be helpful.

When you say "nodes leave the cluster" this sounds very bad, but I can't yet see how that is related. We definitely need to see logs from at least (a) the elected master and (b) the node that left for a few minutes either side of its departure. Look for a log message from the MasterService containing the string node-left, and a log message from the ClusterApplierService saying master node changed.

Agreed about nodes leaving being bad :smile:

Yeah, we looked at hot threads previously (in another thread on here somewhere I started). It all STATS, completion stats, segment stats, etc. I'm not sure why CompletionStats is even running, we have no "suggesters" or anything like that. We do run with the xpack monitoring on though.

Currently we are trying bumping thread_pool.management.max: 8 to match the cores on the data nodes. We are finding that now they are averaging about 6 active during ingestion, 4 active during idle.

:crossed_fingers:

Our index rate ...

And management thread_pool queue:

You can see it really blew up when we cross 30k docs per second

Here's an example of hot threads

93.3% (466.6ms out of 500ms) cpu usage by thread 'elasticsearch[esdata-03ea][management][T#2]'
     2/10 snapshots sharing following 16 elements
       app//org.elasticsearch.index.engine.Engine.fillSegmentStats(Engine.java:830)
       app//org.elasticsearch.index.engine.Engine.segmentsStats(Engine.java:812)
       app//org.elasticsearch.index.shard.IndexShard.segmentStats(IndexShard.java:1028)
       app//org.elasticsearch.action.admin.indices.stats.CommonStats.<init>(CommonStats.java:210)       app//org.elasticsearch.action.admin.cluster.stats.TransportClusterStatsAction.nodeOperation(TransportClusterStatsAction.java:120)       app//org.elasticsearch.action.admin.cluster.stats.TransportClusterStatsAction.nodeOperation(TransportClusterStatsAction.java:52)       app//org.elasticsearch.action.support.nodes.TransportNodesAction.nodeOperation(TransportNodesAction.java:129)       app//org.elasticsearch.action.support.nodes.TransportNodesAction$NodeTransportHandler.messageReceived(TransportNodesAction.java:244)       app//org.elasticsearch.action.support.nodes.TransportNodesAction$NodeTransportHandler.messageReceived(TransportNodesAction.java:240)      app//org.elasticsearch.transport.RequestHandlerRegistry.processMessageReceived(RequestHandlerRegistry.java:63)
       app//org.elasticsearch.transport.TransportService$7.doRun(TransportService.java:752)       app//org.elasticsearch.common.util.concurrent.ThreadContext$ContextPreservingAbstractRunnable.doRun(ThreadContext.java:773)      app//org.elasticsearch.common.util.concurrent.AbstractRunnable.run(AbstractRunnable.java:37)       java.base@13/java.util.concurrent.ThreadPoolExecutor.runWorker(ThreadPoolExecutor.java:1128)       java.base@13/java.util.concurrent.ThreadPoolExecutor$Worker.run(ThreadPoolExecutor.java:628)
       java.base@13/java.lang.Thread.run(Thread.java:830)
     6/10 snapshots sharing following 20 elements
       java.base@13/java.util.TreeMap.getEntry(TreeMap.java:357)
       java.base@13/java.util.TreeMap.get(TreeMap.java:277)       app//org.apache.lucene.codecs.perfield.PerFieldPostingsFormat$FieldsReader.terms(PerFieldPostingsFormat.java:311)
       app//org.apache.lucene.index.CodecReader.terms(CodecReader.java:106)
       app//org.apache.lucene.index.FilterLeafReader.terms(FilterLeafReader.java:366)
       app//org.elasticsearch.index.engine.Engine.completionStats(Engine.java:197)
       app//org.elasticsearch.index.shard.IndexShard.completionStats(IndexShard.java:1048)
       app//org.elasticsearch.action.admin.indices.stats.CommonStats.<init>(CommonStats.java:207)       app//org.elasticsearch.action.admin.cluster.stats.TransportClusterStatsAction.nodeOperation(TransportClusterStatsAction.java:120)       app//org.elasticsearch.action.admin.cluster.stats.TransportClusterStatsAction.nodeOperation(TransportClusterStatsAction.java:52)       app//org.elasticsearch.action.support.nodes.TransportNodesAction.nodeOperation(TransportNodesAction.java:129)       app//org.elasticsearch.action.support.nodes.TransportNodesAction$NodeTransportHandler.messageReceived(TransportNodesAction.java:244)       app//org.elasticsearch.action.support.nodes.TransportNodesAction$NodeTransportHandler.messageReceived(TransportNodesAction.java:240)       app//org.elasticsearch.transport.RequestHandlerRegistry.processMessageReceived(RequestHandlerRegistry.java:63)
       app//org.elasticsearch.transport.TransportService$7.doRun(TransportService.java:752)       app//org.elasticsearch.common.util.concurrent.ThreadContext$ContextPreservingAbstractRunnable.doRun(ThreadContext.java:773)       app//org.elasticsearch.common.util.concurrent.AbstractRunnable.run(AbstractRunnable.java:37)       java.base@13/java.util.concurrent.ThreadPoolExecutor.runWorker(ThreadPoolExecutor.java:1128)       java.base@13/java.util.concurrent.ThreadPoolExecutor$Worker.run(ThreadPoolExecutor.java:628)
       java.base@13/java.lang.Thread.run(Thread.java:830)
     2/10 snapshots sharing following 21 elements
       java.base@13/java.util.TreeMap.getEntry(TreeMap.java:357)
       java.base@13/java.util.TreeMap.get(TreeMap.java:277)       app//org.apache.lucene.codecs.blocktree.BlockTreeTermsReader.terms(BlockTreeTermsReader.java:304)       app//org.apache.lucene.codecs.perfield.PerFieldPostingsFormat$FieldsReader.terms(PerFieldPostingsFormat.java:312)
       app//org.apache.lucene.index.CodecReader.terms(CodecReader.java:106)
       app//org.apache.lucene.index.FilterLeafReader.terms(FilterLeafReader.java:366)
       app//org.elasticsearch.index.engine.Engine.completionStats(Engine.java:197)
       app//org.elasticsearch.index.shard.IndexShard.completionStats(IndexShard.java:1048)
       app//org.elasticsearch.action.admin.indices.stats.CommonStats.<init>(CommonStats.java:207)       app//org.elasticsearch.action.admin.cluster.stats.TransportClusterStatsAction.nodeOperation(TransportClusterStatsAction.java:120)    app//org.elasticsearch.action.admin.cluster.stats.TransportClusterStatsAction.nodeOperation(TransportClusterStatsAction.java:52)       app//org.elasticsearch.action.support.nodes.TransportNodesAction.nodeOperation(TransportNodesAction.java:129)       app//org.elasticsearch.action.support.nodes.TransportNodesAction$NodeTransportHandler.messageReceived(TransportNodesAction.java:244)       app//org.elasticsearch.action.support.nodes.TransportNodesAction$NodeTransportHandler.messageReceived(TransportNodesAction.java:240)       app//org.elasticsearch.transport.RequestHandlerRegistry.processMessageReceived(RequestHandlerRegistry.java:63)
       app//org.elasticsearch.transport.TransportService$7.doRun(TransportService.java:752)       app//org.elasticsearch.common.util.concurrent.ThreadContext$ContextPreservingAbstractRunnable.doRun(ThreadContext.java:773)       app//org.elasticsearch.common.util.concurrent.AbstractRunnable.run(AbstractRunnable.java:37)       java.base@13/java.util.concurrent.ThreadPoolExecutor.runWorker(ThreadPoolExecutor.java:1128)       java.base@13/java.util.concurrent.ThreadPoolExecutor$Worker.run(ThreadPoolExecutor.java:628)
       java.base@13/java.lang.Thread.run(Thread.java:830)

I did see another post you made here @DavidTurner Concurrent Indices stats requests cause cluster to go red

Which gave us the hint to turn off --es.indices from the exporter. But we are still seeing all these CompletionStats ... is there a way to turn off anything to do with completion completely? (Beside staying on ES 2 :wink:)

After switching to NVMe SSD storage my problem seems to be fixed. I had to allocate less JVM memory but still elasticsearch works flawlessly without any issues. I will be running this for another day to conclude it.

2 Likes

whoops I meant to reply on my thread sorry I just noticed :sweat_smile:

1 Like

Yeah, over here still dealing with the app//org.elasticsearch.index.engine.Engine.completionStats(Engine.java:197) always running and sucking up my management threads ... going to attempt to turn off all monitoring tomorrow.

As far as I can tell there's something outside your cluster that is hitting an overly-broad stats API and requesting all completion stats, and the fix is to stop it from doing so. Completion stats are expensive to compute, even if you are not using completion, and you should avoid requesting them if possible. The indices stats API lets clients select the metrics they need, so if you do not need completion stats then you should stop requesting them. I think it's something outside the cluster because Elasticsearch's own monitoring does the right thing here, only requesting the stats it needs:

I think this is trappy, btw, and since there's a few similar cases on the issue I opened https://github.com/elastic/elasticsearch/issues/51915 to discuss a possible improvement. I do also think that we are missing documentation that these stats are expensive to compute.

1 Like

Thanks David. That's the conclusion I'm coming to as well. Big cluster means big stats. Hopefully the load balancer on the coordinator nodes points me at what is doing it ...

I agree with the issue you posted, this was unexpected as we don't use any suggesters and I've also seen a lot of cases out there. I'll keep this ticket posted

1 Like

I'm hoping to wind up with 0 completionStat mentions showing in my hot_threads. Currently I get about 250 occurrences curl -XGET localhost:9200/_nodes/hot_threads | grep completionStat | wc -l

Even with all of our monitoring turned off, we quickly see all hot_threads become completionStats like this:

 java.base@13/java.util.TreeMap.getEntry(TreeMap.java:357)
       java.base@13/java.util.TreeMap.get(TreeMap.java:277)
       app//org.apache.lucene.codecs.blocktree.BlockTreeTermsReader.terms(BlockTreeTermsReader.java:304)
       app//org.apache.lucene.codecs.perfield.PerFieldPostingsFormat$FieldsReader.terms(PerFieldPostingsFormat.java:312)
       app//org.apache.lucene.index.CodecReader.terms(CodecReader.java:106)
       app//org.apache.lucene.index.FilterLeafReader.terms(FilterLeafReader.java:366)
       app//org.elasticsearch.index.engine.Engine.completionStats(Engine.java:197)
       app//org.elasticsearch.index.shard.IndexShard.completionStats(IndexShard.java:1048)
       app//org.elasticsearch.action.admin.indices.stats.CommonStats.<init>(CommonStats.java:207)
       app//org.elasticsearch.action.admin.cluster.stats.TransportClusterStatsAction.nodeOperation(TransportClusterStatsAction.java:120)
       app//org.elasticsearch.action.admin.cluster.stats.TransportClusterStatsAction.nodeOperation(TransportClusterStatsAction.java:52)
       app//org.elasticsearch.action.support.nodes.TransportNodesAction.nodeOperation(TransportNodesAction.java:129)
       app//org.elasticsearch.action.support.nodes.TransportNodesAction$NodeTransportHandler.messageReceived(TransportNodesAction.java:244)
       app//org.elasticsearch.action.support.nodes.TransportNodesAction$NodeTransportHandler.messageReceived(TransportNodesAction.java:240)
       app//org.elasticsearch.transport.RequestHandlerRegistry.processMessageReceived(RequestHandlerRegistry.java:63)
       app//org.elasticsearch.transport.InboundHandler$RequestHandler.doRun(InboundHandler.java:264)
       app//org.elasticsearch.common.util.concurrent.ThreadContext$ContextPreservingAbstractRunnable.doRun(ThreadContext.java:773)
       app//org.elasticsearch.common.util.concurrent.AbstractRunnable.run(AbstractRunnable.java:37)
       java.base@13/java.util.concurrent.ThreadPoolExecutor.runWorker(ThreadPoolExecutor.java:1128)
       java.base@13/java.util.concurrent.ThreadPoolExecutor$Worker.run(ThreadPoolExecutor.java:628)
       java.base@13/java.lang.Thread.run(Thread.java:830)

Turning off xpack now

@DavidTurner Looking at this https://github.com/elastic/elasticsearch/blob/v7.4.1/server/src/main/java/org/elasticsearch/action/admin/cluster/stats/TransportClusterStatsAction.java#L120 (And my Latin isn't great ...) but isn't this calling completionStats for every shard every time there's a cluster stats call?

Oh good lord.

1 Like

Yes, you're quite right, I think this means cluster stats is also computing completion stats and there's no way to switch that off :confused:

1 Like

@DavidTurner saved the day! So once that was confirmed started watching for who was calling /_cluster/stats and found "NetData" hang out on all our AMI's that we'd forgotten about. It saw Elasticsearch running locally and began calling _cluster/stats every 5 seconds! Per data node, * 24 data nodes. We removed the service and the CPU just started dropping. Thanks for watching the forums!

Cheers!

1 Like

To give props where it's due: Elasticsearch 7.4.1 was dealing with a massive state query every 5 seconds from 32 different nodes and yet didn't stop ingesting data or responding to queries. Anything that didn't touch cluster state still responded. That's pretty awesome.

Yes, it would've been nice to have got rejection notices for cluster state, but at least it was doing it's core business.

Keep that in mind guys :wink: core business ...

Good catch, yes, that'd explain it. 5 cluster-wide stats calls per second is definitely on the abusive side. When you weren't indexing it looks like you had enough resources (particularly, IO bandwidth) to cope with the monitoring load, but it seems that the extra load from indexing pushed it over the edge.

I think we can generally do better here, optimisations of the completion stats calculation aside, so I opened https://github.com/elastic/elasticsearch/issues/51992 to discuss higher-level protection against this.

2 Likes