Calculate Apdex value in elasticsearch

Hello,

Recently, we migrated our New Relic APM stack to escloud but we realised there is no official way to calculate the Apdex value. There is this new User Experience App but some people from our company are still requesting the Apdex value. Were are still an unexperienced team working with elastic and the options we have found searching for implementing Apdex were not 100% clear.
We would appreciate if someone who had the same problem and was able to solve it could give us a hand. Maybe using an scripted field, pipelines or other options. Right now we are sending APM transactions along with RUM transactions. Any extra info that you need we will be available to send it.

Thanks in advance

Hello Mario,

welcome to the community. The Apdex value seems to be a New Relic measurement.
I found some high level formulas that New Relic is using. Can you describe a little more what you like to achieve by looking at this value? Also: Do you may have any kind of formula that can be calculated to get the Abdex value?
Based on the formula we can help you find the right way to build that within Elastic.

Best regards

Hi Felix,

Thank you :slight_smile:
The Apdex measurement is a request from our development team as it is what they were using before moving our APM from NewRelic to escloud.
To calculate the Apdex score we use the following formula:

			SatisfiedCount + (ToleratingCount * 0.5) + (FrustratedCount * 0)
Apdex t =	----------------------------------------------------------------
	                          		TotalSamples    

The idea is to count requests with satisfactory response time as 1, requests with tolerable response time as 0.5 and requests with response time greater than tolerable as 0 and finally calculate the average. The threshold of a request with the satisfactory time we call t and the tolerable value is defined by 4*t

To implement this formula in elastic, we added a script processor to traces-apm-8.1.2 pipeline that consists of creating a label called apdexscore, containing the value 1, 0.5 or 0 according to the duration in microseconds of the transaction. We set the t-factor in the script to 800 milliseconds:

[
.
..
  {
    "script": {
      "lang": "painless",
      "source": "double apdex_t = 800.0 * 1000;\nif (ctx.labels==null) {\nctx.labels = [:];\n}\nif (ctx.transaction.duration.us <= apdex_t) {\nctx.labels.apdexscore=1.0;\n}\nelse if (ctx.transaction.duration.us <= (apdex_t * 4)) {\nctx.labels.apdexscore=0.5;\n}\nelse {\nctx.labels.apdexscore=0.0;\n}",
      "ignore_failure": true
    }
  },
..
.
]

The formula worked and after creating traces-apm* dataview, we saw that it gives us the apdex score in the new field labels.apdexscore. We were even able to create a Dashboard so visualize the apdex score.

Our problem now resides in what pipelines we should implement this formula as there are different APM indexes that might be neccesary to implement and thern create a DataView to visualize all APM indexes. We thought in creating a new pipeline like the following:

PUT /_ingest/pipeline/apdex
{
	"description": "ApDex",
	"processors": [
	{
		"script": {
			"lang": "painless",
			"ignore_failure": true,
			"source": """
				double apdex_t = 800.0 * 1000;
				if (ctx.labels==null) {
				ctx.labels = [:];
				}
				if (ctx.transaction.duration.us <= apdex_t) {
				ctx.labels.apdexscore=1.0;
				}
				else if (ctx.transaction.duration.us <= (apdex_t * 4)) {
				ctx.labels.apdexscore=0.5;
				}
				else {
				ctx.labels.apdexscore=0.0;
				}
			"""
		}
	}
	]
}

and then add it to the apm pipeline:

{
    "pipeline": {
      "name": "apdex"
    }
}

but it didn't work as expected as apm pipeline doesn't cover all APM indexes.

Do you know how we could proceed on this? Is there a master pipeline that covers all indexes? Or should we add the formula to all APM pipelines?

I attach a list of APM indexes and Data Streams currently in use.

Indexes:

.ds-logs-apm.error-default
.ds-traces-apm.rum-default
.ds-traces-apm-default
.ds-metrics-apm.internal-default
.ds-logs-apm.error-default

Data Streams:

logs-apm.error-default
metrics-apm.internal-default
traces-apm-default
traces-apm.rum-default

Kind Regards
Hi Mario,

I think the best approach is to create a dataview for apm* which includes every apm index. Within the dataview you can create a new field with calculated value. Those fields are called runtime fields. This will calculate the value for all existing documents on runtime, which can slow down the query a little bit.

If you would like to stay with the pipeline to prevent the slow down effect you need to create an index template that covers all apm* indices. I think there is already one. For every template you can configure a default_pipeline or final_pipeline. In your case I would add the script as final pipeline to that index template.
Find more info here:

Hi Felix,

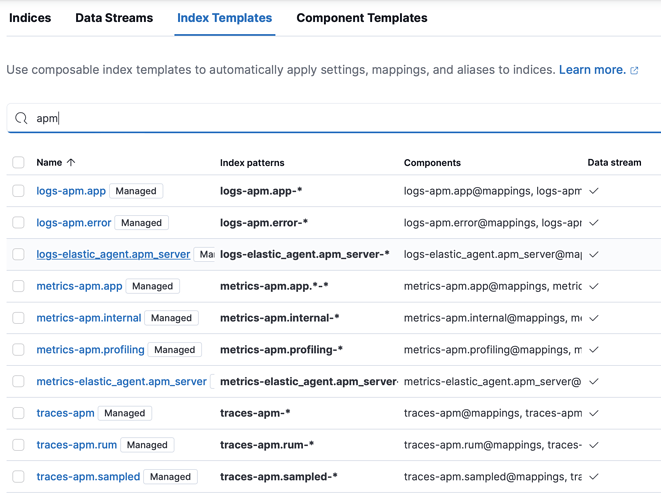
Thanks for your answer. Which index template covers all apm indexes? I'm not sure there is one index that does that. I attach an screenshot with all the existing apm index templates.

Best Regards

Hi Mario,

I've talked about Data View / Index Pattern in the Kibana Configuration. No need to do that in the index template.

The Data View / Index Pattern to cover all is apm*

Hi @Felix_Roessel

We finally managed to add the apples score value and create some visualisations. We even created a watcher that works with the simulation but it doesn't work by trigger alerts. Elastic support is taking a looks as the cannot find why it doesn't work. It could be a bug.

I attach here the final result to extract the apdex score from the apm pipeline and also the watcher. It could be useful for others :slight_smile:

  • Pipeline
{
    "script": {
      "lang": "painless",
      "source": "double apdex_t = 800.0 * 1000;\nif (ctx.labels==null) {\nctx.labels = [:];\n}\nif (ctx.transaction.duration.us <= apdex_t) {\nctx.labels.apdexscore=1.0;\n}\nelse if (ctx.transaction.duration.us <= (apdex_t * 4)) {\nctx.labels.apdexscore=0.5;\n}\nelse {\nctx.labels.apdexscore=0.0;\n}",
      "ignore_failure": true
    }
  },
  • Watcher
{
  "trigger": {
    "schedule": {
      "interval": "5m"
    }
  },
  "input": {
    "search": {
      "request": {
        "search_type": "query_then_fetch",
        "indices": [
          "traces-apm*"
        ],
        "rest_total_hits_as_int": true,
        "body": {
          "size": 0,
          "query": {
            "bool": {
              "filter": [
                {
                  "range": {
                    "@timestamp": {
                      "gte": "now-5m"
                    }
                  }
                }
              ]
            }
          },
          "aggs": {
            "services": {
              "terms": {
                "field": "service.name",
                "size": 30
              },
              "aggs": {
                "avg_apdexscore": {
                  "avg": {
                    "field": "labels.apdexscore"
                  }
                }
              }
            }
          }
        }
      }
    }
  },
  "condition": {
    "script": {
      "source": """
      return ctx.payload.aggregations.services.buckets.stream()       
        .filter(services -> services.avg_apdexscore.value < 0.8)               
        .count() > 0 
      """,
      "lang": "painless"
    }
  },
  "actions": {
    "log": {
      "transform": {
        "script": {
          "source": """
        return ctx.payload.aggregations.services.buckets.stream()       
        .filter(services -> services.avg_apdexscore.value < 0.8)               
        .collect(Collectors.toList());
        """,
          "lang": "painless"
        }
      },
      "logging": {
        "level": "info",
        "text": """
        {{#ctx.payload._value}} service.name={{key}} is below 0.8 with labels.apdexscore={{avg_apdexscore.value}}
        {{/ctx.payload._value}}
        """
      }
    },
    "notify-slack": {
      "throttle_period_in_millis": 300000,
      "transform": {
        "script": {
          "source": """
        return ctx.payload.aggregations.services.buckets.stream()       
        .filter(services -> services.avg_apdexscore.value < 0.8)               
        .collect(Collectors.toList());
        """,
          "lang": "painless"
        }
      },
      "slack": {
        "message": {
          "text": """{{#ctx.payload._value}} service.name={{key}} is below 0.8 with labels.apdexscore={{avg_apdexscore.value}} 
          {{/ctx.payload._value}}"""
        }
      }
    }
  }
}

Regards

This topic was automatically closed 28 days after the last reply. New replies are no longer allowed.