Hi Guys!
We have a problem with our Elastic APM, since yesterday we have not been able to view the data
The only mistake I found was in the index pattern.
Images attached.
Kibana version : 7.11
Elasticsearch version : 7.11
APM Server version : 7.11
stephenb
March 4, 2021, 8:16pm
2
Hi @Luis_Garavatti welcome to the community and thanks for trying elastic APM, ohh and BTW we are not all guys
Can you check in Discover set index pattern to apm-* see if you are receiving telemetry.
Hi @stephenb thanks for this!
The Index Pattern it's correct check this..
Is that what you are talking about?
Tks
@stephenb , about Discovery, yes we receiving data.
stephenb
March 5, 2021, 12:20am
5
Can you show, Which fields have conflict in the index pattern....
Can you show Discovery with apm-* for last 1h.
The filter on
processor.event : "transaction"
And toggle on the service.name column should look like this?
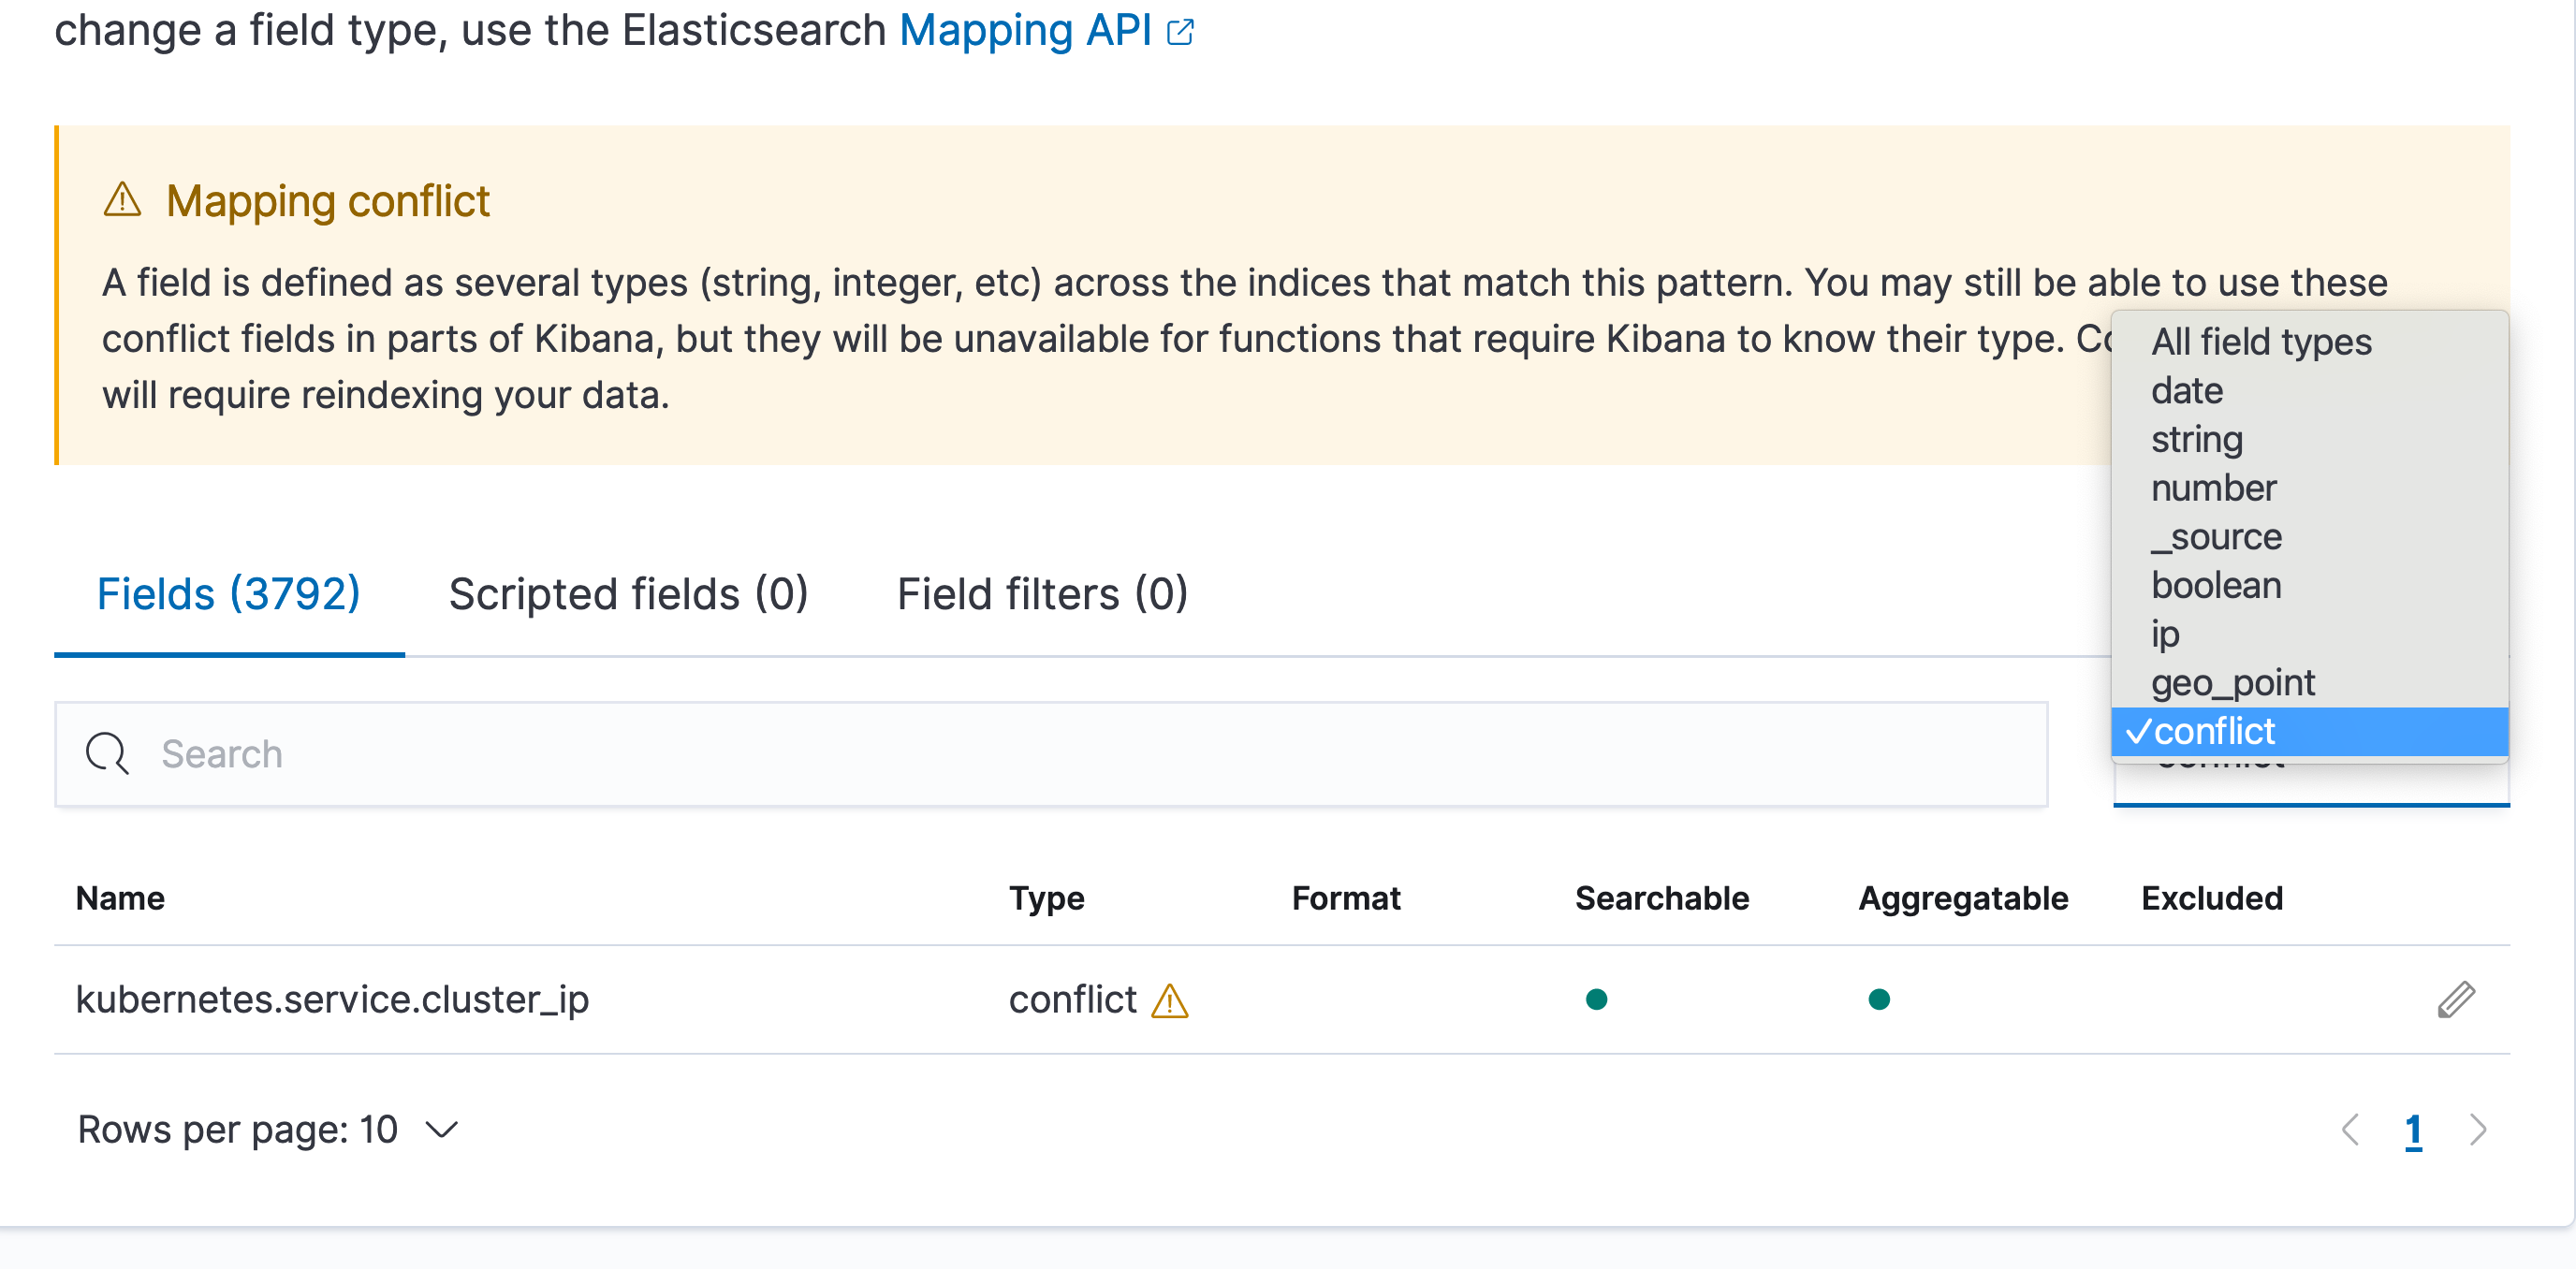
What fields have the mapping conflits in the index patterns
Yes, I'm know which fields having mapping conflicts.
But I don't know how to solve it, and I don't know if that's the problem.
In the APM server logs nothing appears.
The fields had the mapping conflits these are:
stephenb
March 5, 2021, 2:54am
7
Those conflicts should not affect the APM UI, we will worry about them later.
What about the discovery questions I asked?
And exactly which distribution are you using?
Did you modify Kibana? This does not look like our normal kibana
Ohh you turned on v8 Theme in advanced settings which is beta, perhaps go back to the production theme and see if you are having the same issues.
Please show discovery with APM-* data + service names for transactions
I don't know about the v8 theme, how to disable it?
About your question, discover it's ok look this
My distribution is 7.11 (Kibana, Elastic and APM)
Tks for help!
stephenb
March 5, 2021, 4:58am
9
The theme is in
Stack Management / Advanced Settings search for Theme set it back to v7. Save and refresh. I don't think that is it, but let's eliminate it.
I changed, but not success!
Other ideas?
stephenb
March 5, 2021, 6:51am
11
This is strange / not normal.
You can try to Stop and start the apm server, Stop and Start all the components....
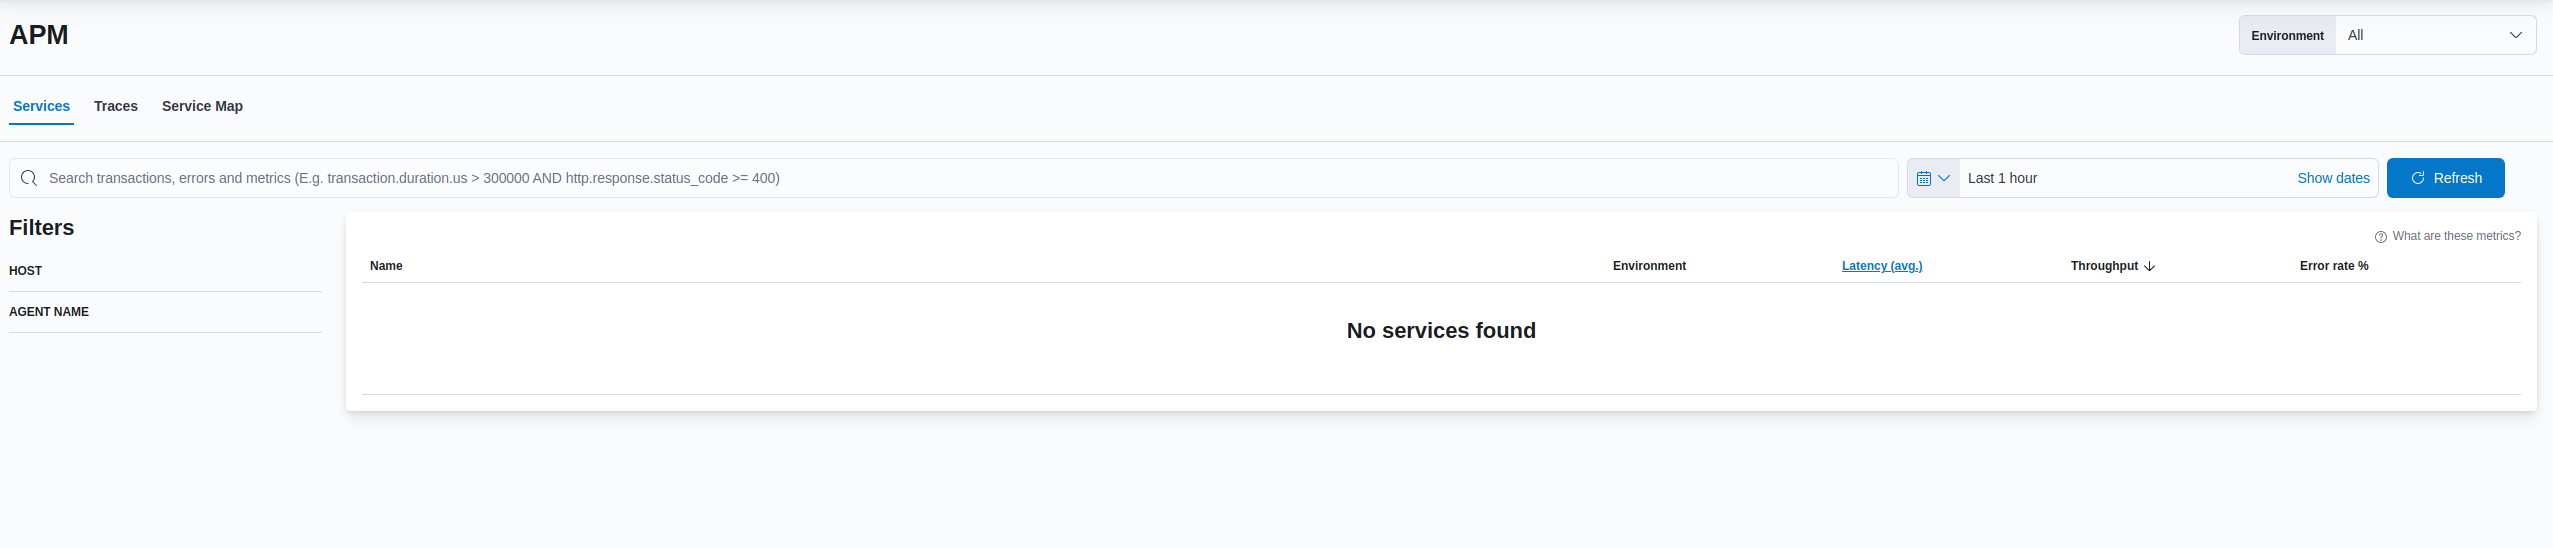
Did you ever get the services to show up in the APM App?
How many settings did you or someone else tweak? In Kibana or APM Server, Agents etc?
If you use all the defaults and just set the apm-server in the agents everything should work out of the box.
Did you set an special settings in the agent?
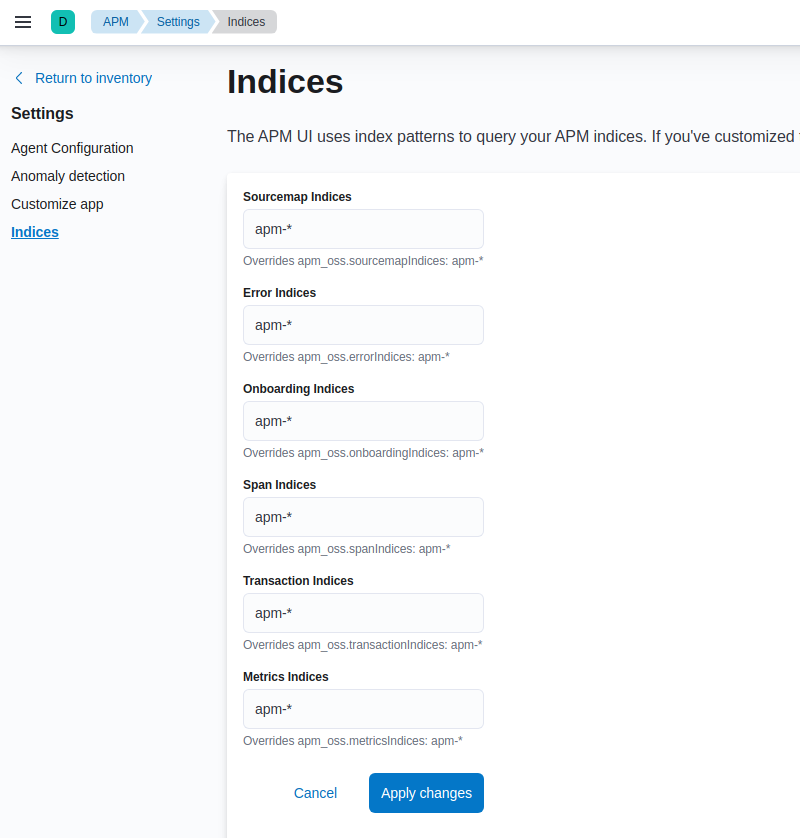
Example In my view of the APM / Setting / indicies mine are all greyed out defaults, did you actually apply the changes you had above.
Look this,
Before 03/02/2021 my services appears!!
Yes, I'm tried stopped all services but not success!
This is my conf apm-server.yml
Until at 03/02/2021 works
Sorry I meant until 2/3/2021 it works
stephenb
March 5, 2021, 7:07am
17
And your logged in as the elastic user (superuser) in the default space? end of day for me... I would look for what change at that last date
Did you stop and start the spm server?
And you haven't run out of disk space or something.
Yes, I'm logged with elastic user. No I didn't run out of space because indexes are being created, they not showing in apm only.
stephenb
March 5, 2021, 3:01pm
19
Can you run
GET _cat/indices/apm-*/?v
In Dev tools And post the results
I do not know what is happening.
When things work and then stop working something generally has changed whether we know what it is or not.
Depending on how valuable your data is if this is just test at this point you could
stop the APM server
Stop the agents
Delete the APM indices in elastic
Then start the APM server
Then start the client apps again
Hi, @stephenb , sorry for delay.
Look this...
It's possible rename the indexes to create again??
Tks